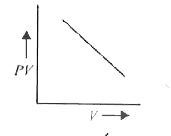
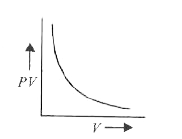
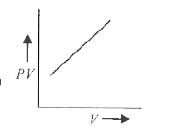
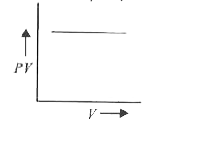
Which of the following graphs represent the behaviour of an ideal gas ?Solution in Kannada
A

B

C

D

Video Solution
Text Solution
The correct Answer is:D
For an ideal gas, for a given mass, PV=constant, whatever may be the volume.
|
Similar Questions
Which of the following graphs represent the behaviour of an ideal gas ?
View SolutionWhich curve in the following graph represents the curve of ideal gas ?
View SolutionWhich of the following graphs represent the behaviour of an ideal gas ?
View SolutionWhich of the following correctly represent the behaviour of an ideal gas
View SolutionWhich of the following correctly represent the behaviour of an ideal gas
View SolutionWhich of the following shows ideal gas behaviour
View SolutionWhich of the following graphs represent the behaviour of an ideal gas ?
View SolutionWhich of the following graphs is consistent with ideal gas behaviour?
View Solution

