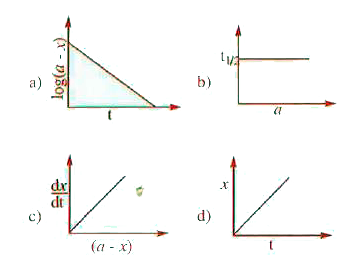
Which of the following graphs represent a first order reaction (a=initial concentration of reactant, x=concentration of reactant consumed, t=time)
 Solution in Telugu
a,b,d
c,d
b,c
a,b
The correct Answer is:C
Step by step video, text & image solution for Which of the following graphs represent a first order reaction (a=initial concentration of reactant, x=concentration of reactant consumed, t=time) by Chemistry experts to help you in doubts & scoring excellent marks in Class 12 exams.
Updated on:21/07/2023Similar Questions
Plot a graph of concentration of a reactant at time t, [ (a-x)] against time for a first order reaction .Here a = initial concentration of the reactant an x = change in concentration of the reactant at any time 1 during the reaction.
View SolutionFor a first order reaction, the concentration of reactant :
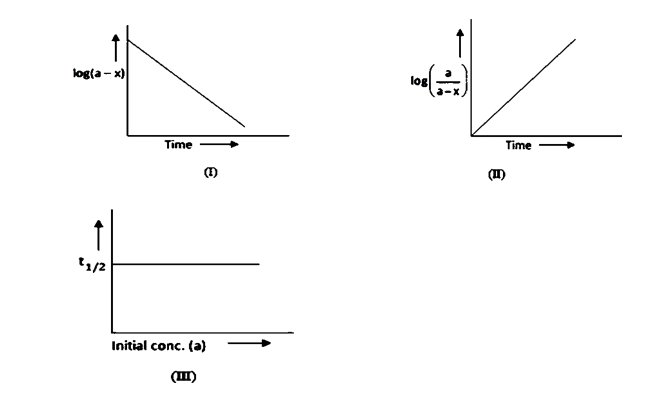
View SolutionWhich of the following is/are correct for the first order reaction ? (a is initial concentration of reactant, x is concentration of the reactant reacted and t is time)

View SolutionWhich of the following graphs represent a first order reaction (a=initial concentration of reactant, x=concentration of reactant consumed, t=time)

View SolutionC_(o) =initial concentration of the reactant C_(t) = concentration of the reactant at time t, k=rate constant of the reaction. Then the equation applicable for a first order reaction is
View SolutionFor a first order reaction, if ‘a’ is the initial concentration of reactant, then the half life time is
View SolutionWhich of the following is/are correct for the first order reaction ? (a is initial concentration of reactant, x is concentration of the reactant reacted and t is time)
View Solution
