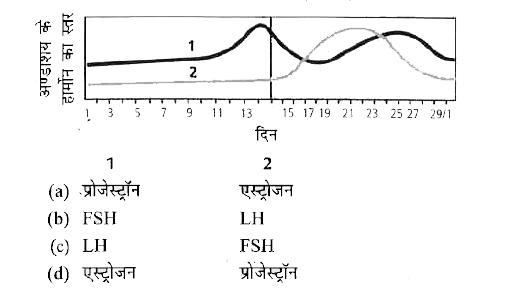
The graph given below shows the variations in the levels of ovarian hormones during various phases of menstrual cycle:
Specify the source of the hormone marked in the diagram.
 Solution in Punjabi
Step by step video & image solution for The graph given below shows the variations in the levels of ovarian hormones during various phases of menstrual cycle: Specify the source of the hormone marked in the diagram. by Biology experts to help you in doubts & scoring excellent marks in Class 12 exams.
Updated on:21/07/2023Similar Questions
नीचे दिया गया ग्राफ ऋतु स्राव चक्र के दौरान ओवेरीयन हार्मोन्स के स्तर को दर्शाता है। 1 व 2 क्या दर्शाते हैं?

View SolutionThe graph given below shows the variations in the levels of ovarian hormones during various phases of menstrual cycle: Identify A and B .
View SolutionThe graph given below shows the variations in the levels of ovarian hormones during various phases of menstrual cycle:
Reason out why A peaks before B.

View SolutionThe graph given below shows the variations in the levels of ovarian hormones during various phases of menstrual cycle: Compare the role of A and B .
View SolutionThe graph given below shows the variations in the levels of ovarian hormones during various phases of menstrual cycle: Under which condition will the level of B continue to remain high on the 28^th day?
View SolutionThe graph shows the level of ovarian hormones in a normally menstruating women during follicular phase. Reconstruct the hormonal graph for luteal phase. .
View SolutionThe following graph shows the levels of ovarian hormones during a menstrual cycle. What do 1 and 2 represent ?

View Solution
