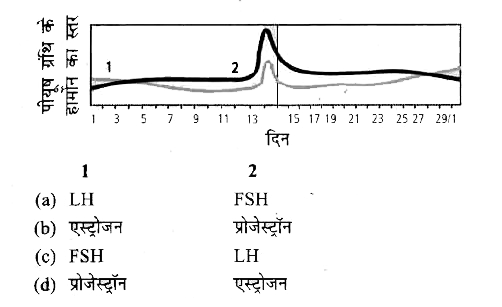
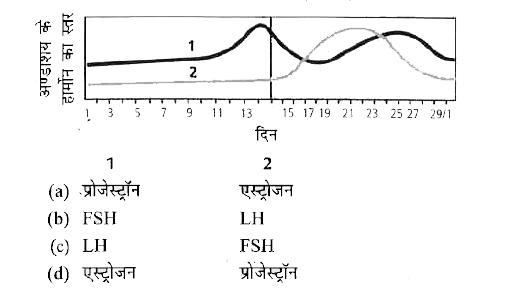
The following graph shows the levels of ovarian hormones during a menstrual cycle. What do 1 and 2 represent ?

Progesterone, Estrogen
FSH,LH
LH,FSH
Estrogen,Progesterone
Step by step video solution for The following graph shows the levels of ovarian hormones during a menstrual cycle. What do 1 and 2 represent ? by Biology experts to help you in doubts & scoring excellent marks in Class 12 exams.
Updated on:21/07/2023Topper's Solved these Questions
- HUMAN REPRODUCTION Book:CENGAGE BIOLOGY ENGLISHChapter:HUMAN REPRODUCTION Exercise:Assertion -Reasoning Question
Explore 16 Videos
- HUMAN HEALTH AND DISEASEBook:CENGAGE BIOLOGY ENGLISHChapter:HUMAN HEALTH AND DISEASEExercise:ARCHIVES
Explore 46 Videos
- MICROBES IN HUMAN WELFAREBook:CENGAGE BIOLOGY ENGLISHChapter:MICROBES IN HUMAN WELFAREExercise:ARCHIVES
Explore 26 Videos
Similar Questions
Assertion: Scrotum provides optimum temperature conditions for spermatogenesis.
Reason : Dartos and cremaster muscles in scrotum contract and relax involuntarily in response to temperature.
View SolutionIncreased asthmatic attacks in certain seasons are related to
View SolutionCry 1 endotoxins obtins obtained from Bacillus thuringiensis are efficetive against
View SolutionThe following grap[hs shows the lvevels of pituitary hormones during a menstrual cycle. What do 1 and 2 represent?
View SolutionThe following graph shows the levels of ovarian hormones during a menstrual cycle. What do 1 and 2 represent?
View SolutionExplain the ovarian and uterine events that occur during a menstrual cycle in a human female, under the influence of Pituitary and Ovarian hormones respectively.
View SolutionDescribe the role of pituitary and ovarian hormones during the menstrual cycle in a human female .
View SolutionExplain the ovarian and uterine events that occur during a menstrual cycle in a human female, under the influence of Pituitary and Ovarian hormones respectively.
View SolutionDesribe the roles of pituitary and ovarian hormones during the menstrual cycle in a human female .
View Solution
The following grap[hs shows the lvevels of pituitary hormones during a menstrual cycle. What do 1 and 2 represent?
View Solution
The following graph shows the levels of ovarian hormones during a menstrual cycle. What do 1 and 2 represent?
View SolutionRefer to the given graph representing interplay of different hormones (A-D) during menstrual cycle in women and answer the question that follow. Which hormones is most effective in producing uterine changes during menstrual cycle?
View Solutionनीचे दिया गया ग्राफ एक ऋतु स्राव चक्र के दौरान पिट्यूटरी हार्मोन्स के स्तरों को दर्शाता है। 1 व 2 क्या दर्शाते हैं?

View Solutionनीचे दिया गया ग्राफ ऋतु स्राव चक्र के दौरान ओवेरीयन हार्मोन्स के स्तर को दर्शाता है। 1 व 2 क्या दर्शाते हैं?

View SolutionThe graph given below shows the variations in the levels of ovarian hormones during various phases of menstrual cycle: Identify A and B .
View SolutionThe graph given below shows the variations in the levels of ovarian hormones during various phases of menstrual cycle: Specify the source of the hormone marked in the diagram.
View Solution
