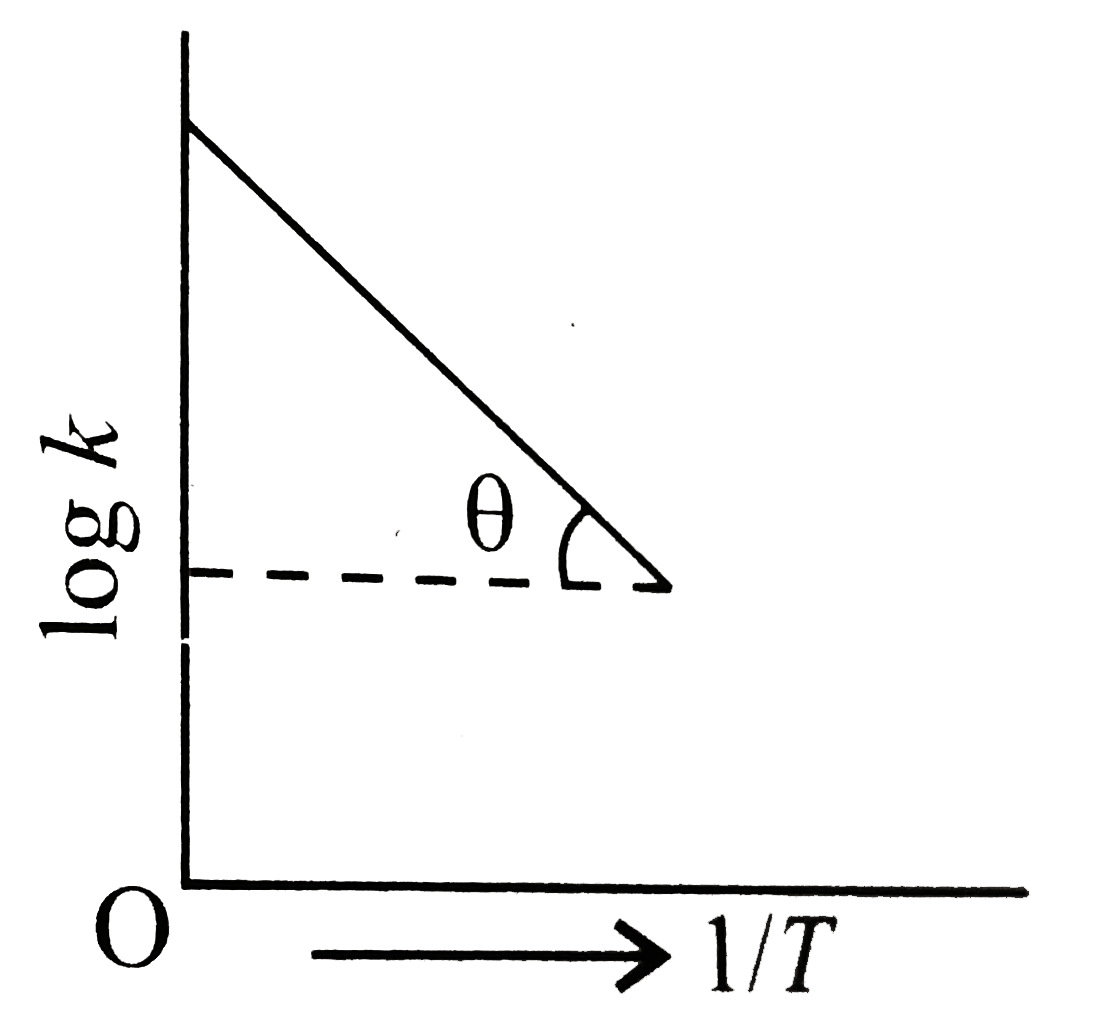
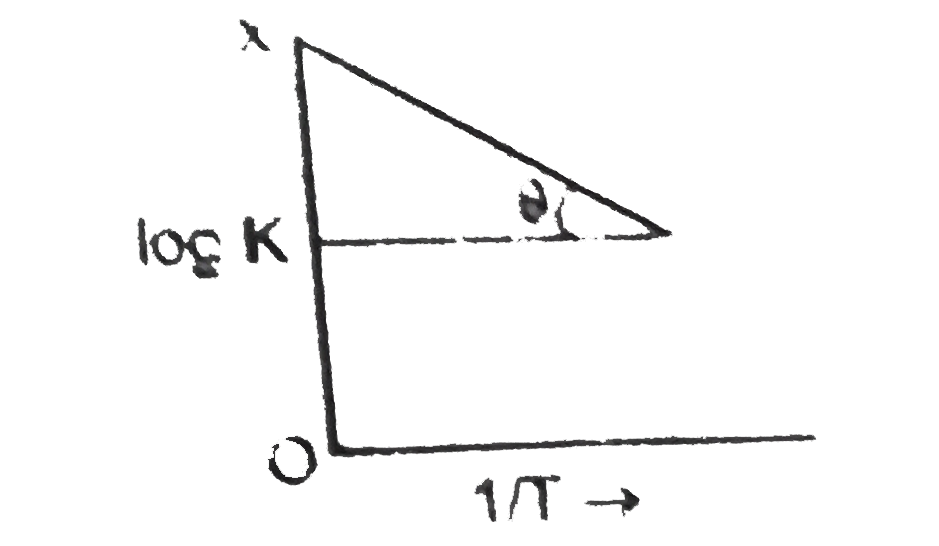
Graph between logk and 1/T [k rate constant (s−1) and T and the temperature (K)] is a straight line with OX=5,θ=tan−1(1/2.303). Hence −Ea will be

2.303×2cal
22.303cal
2cal
None of these
The correct Answer is:3
We know, logK=logA−Ea2.303RT
compare this by y=mx+c
m=−Ea2.303Rslpe of this
Given −Ea2.303R=−12.303
Ea=R=2cal
Topper's Solved these Questions
- CARBONYL COMPOUNDS (ALDEHYDES & KETONES ) & CARBOXYLIC ACID Book:RESONANCE ENGLISHChapter:CARBONYL COMPOUNDS (ALDEHYDES & KETONES ) & CARBOXYLIC ACID Exercise:Part -IV
Explore 21 Videos
- CHEMISTRY IN EVERYDAY LIFEBook:RESONANCE ENGLISHChapter:CHEMISTRY IN EVERYDAY LIFEExercise:ORGANIC CHEMISTRY(Chemistry in every day life)
Explore 31 Videos
Similar Questions
The product of the reaction

View SolutionWhich is the correct statement about birth control pills?
View SolutionGraph between logk and 1/T [k rate constant (s−1) and T and the temperature (K)] is a straight line with OX=5,θ=tan−1(1/2.303). Hence −Ea will be

View SolutionThe graph between log k versus 1//T is a straight line.
View SolutionGraph between log k and (1)/(T) (k is rate constant in s^(-1) and T is the temperature in K) is a straight line. As shown in figure if OX = 5 and slope of the line =- (1)/(2.303) then E_(a) is :
View SolutionThe slope of straight line graph between ln k us 1T is equal to 2.4×10⁴K. Calculate the activation energy of the reaction at 400 K. (K represents rate constant)
View SolutionGraph between log k and 1//T [where K is rate constant in s^(-1) and T is the temperature (in K) is a straight line with Hence, E_(a) will be
View SolutionThe rate constant 'k'. For a reaction varies with temperature 'T' according to the question. logk=logA−Ea2.303R(1T)
Where Ea is the activation energy. When a graph is plotted for logkvs1/T, a straight line with a slope of −4250 K is obtained. Calcualte Ea for this reaction.
View SolutionThe graph between log k and 1/T[K is rate constant (sec−1) and T the temperature (K)] is a straight line with OX=5andθ=tan−1(−12.303).Calculate the value of Ea is cal. ?

View SolutionVariation of equiibrium constant K with temperature T is given by van 't Holf equation,
logK=logA−ΔH∘2.303RT
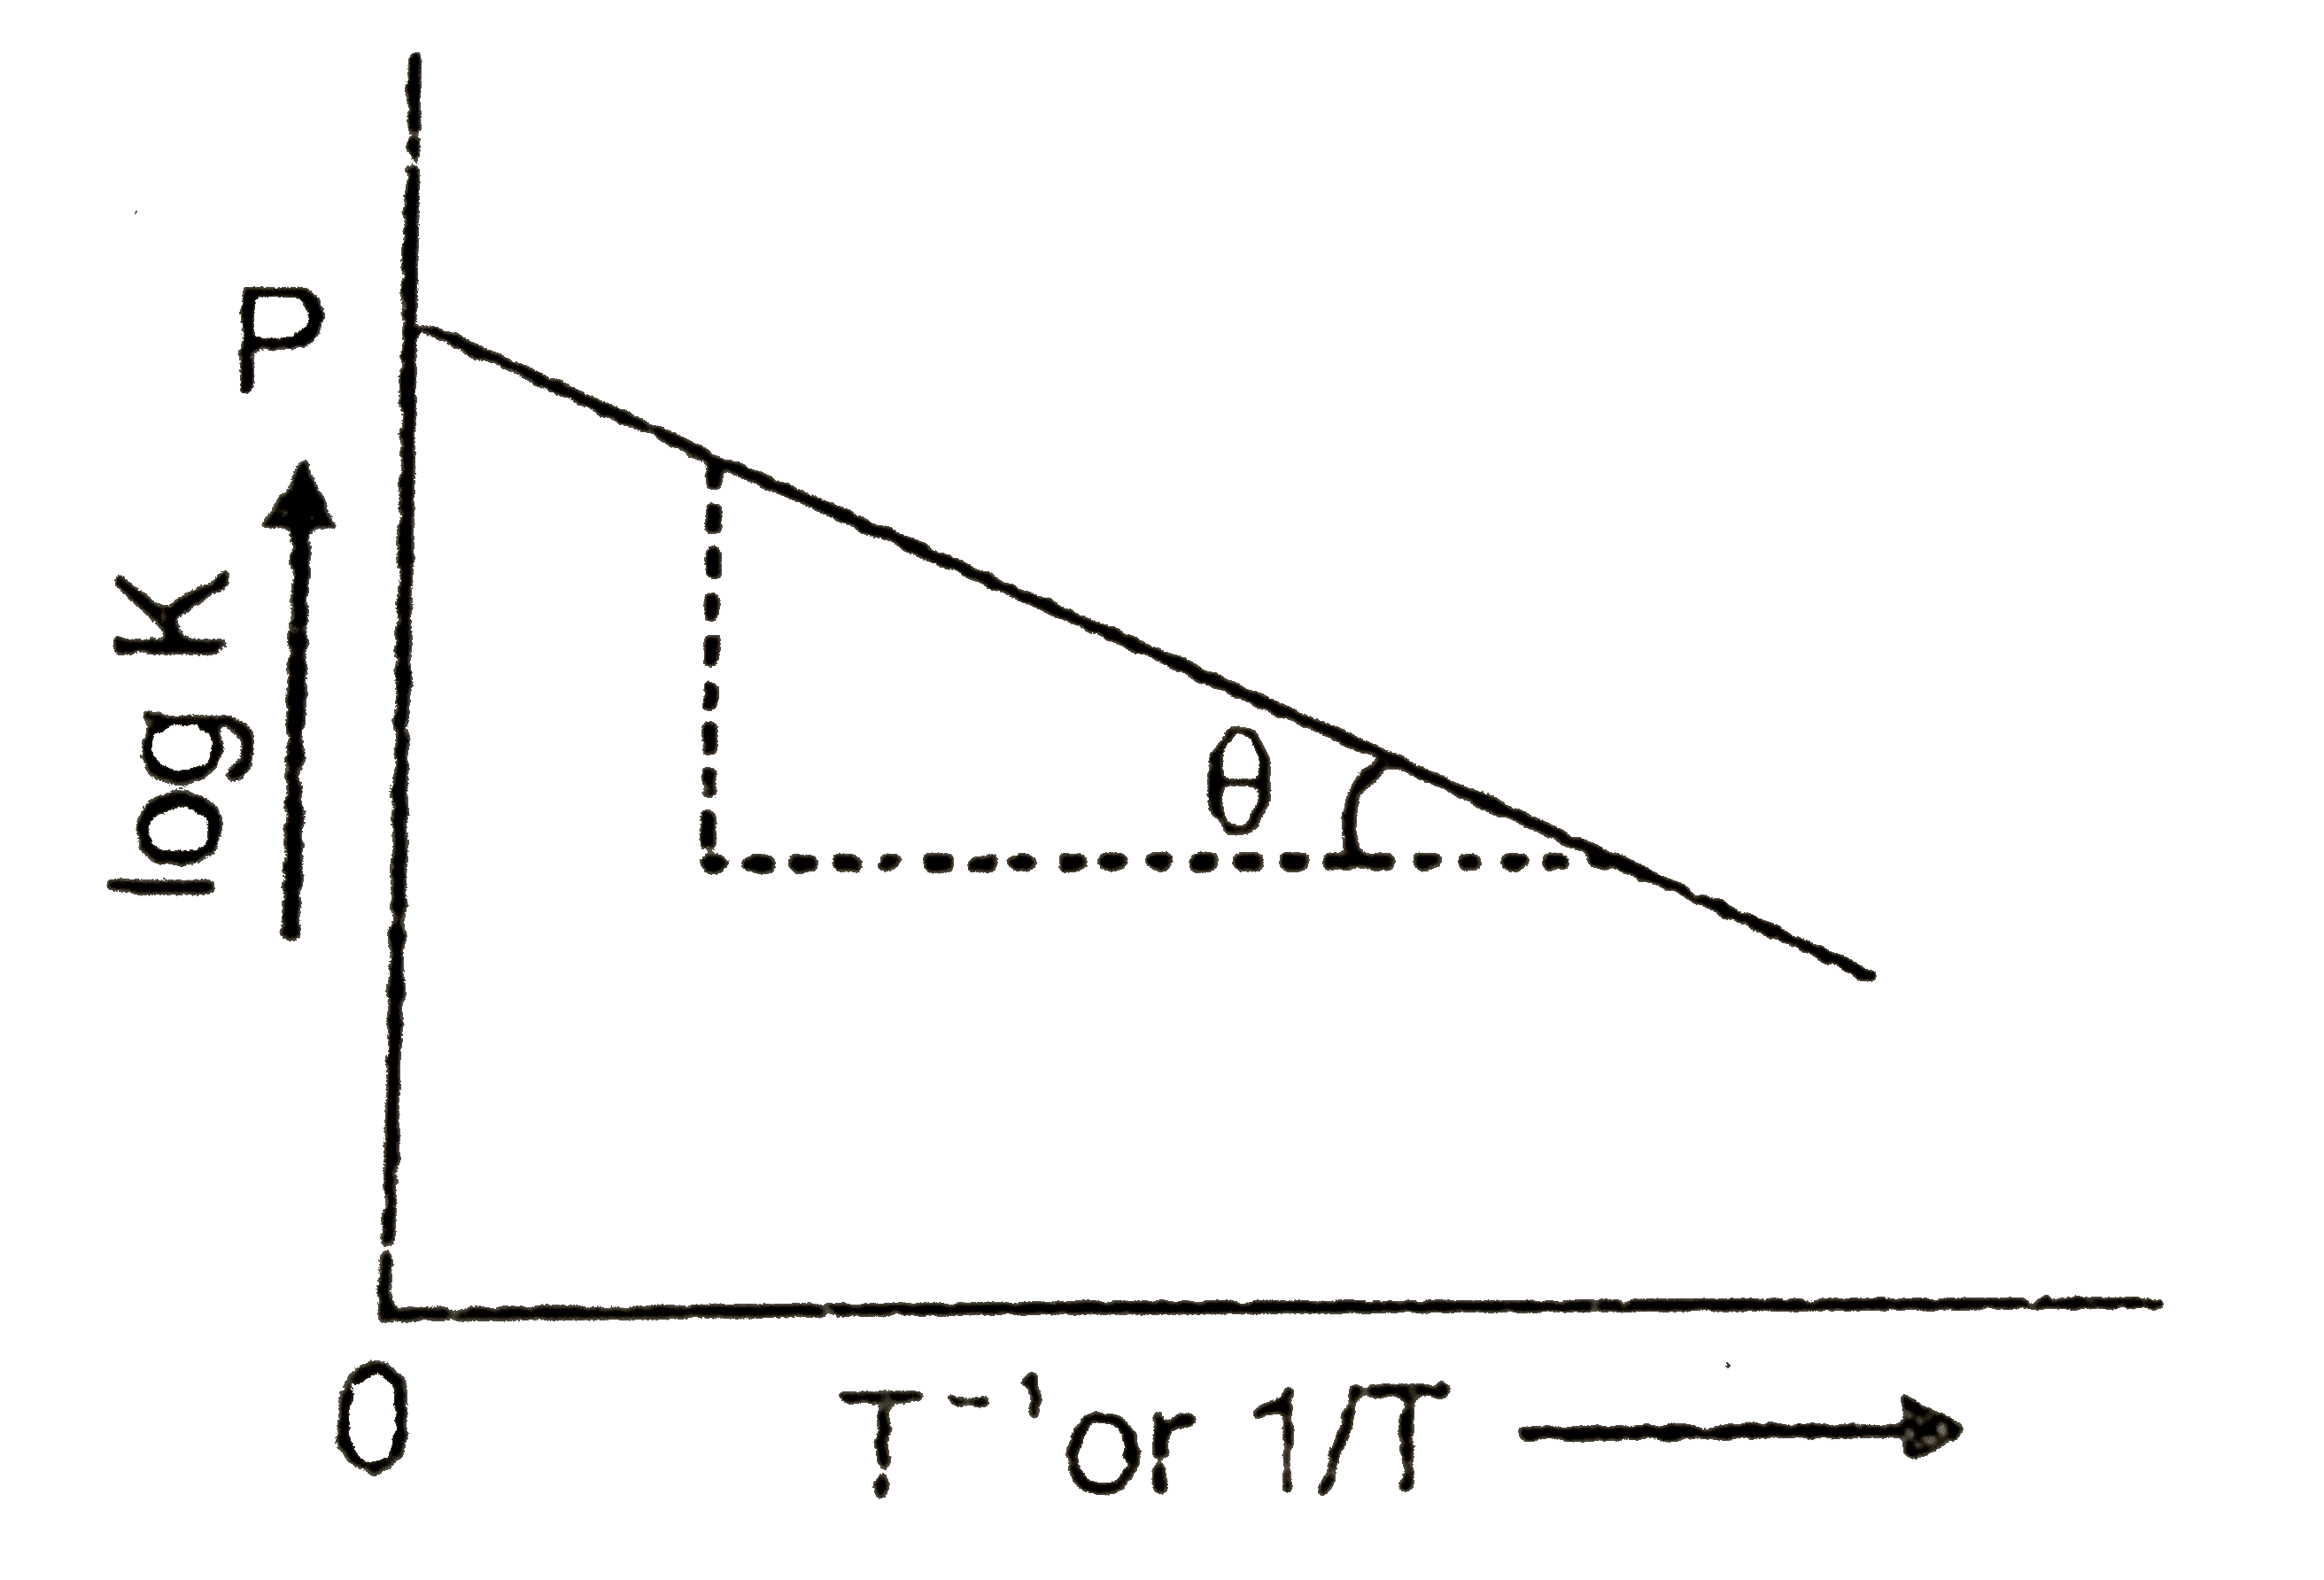
A graph between log K and T−1 was a straight line as shown in the figure and having θ=tan−1(0.5)andOP=10. Calculate:
(a) ΔH∘ (standard heat of reaction)when T=300K,
(b) A (pre-exponetial factor),
(c) Equilibrium constant K at 300K,
(d) Kat900KifΔH∘ is independent of temperature.

View SolutionThe rate constant 'k'. For a reaction varies with temperature 'T' according to the question. logk=logA−Ea2.303R(1T)
Where Ea is the activation energy. When a graph is plotted for logkvs1/T, a straight line with a slope of −4250 K is obtained. Calcualte Ea for this reaction.
View SolutionK represents the rate constant of a reaction when log K is p lotted again st 1/T (T=temperature) the graph obtained is a
View SolutionGraph between logk and 1/T [k rate constant (s−1) and T and the temperature (K)] is a straight line with OX=5,θ=tan−1(1/2.303). Hence −Ea will be

View Solutionदर स्थिरांक k का तापमान T(R) के साथ विक्षेपण निम्न समीकरण द्वारा दर्शाया जाता है
logk=logA−Ea2.303RT
logk और 1T के बीच खींचा गया ग्राफ एक सीधी रेखा है, अतः कहा जा सकता है
View SolutionFigure shows a graph in log K vs 1/T where K is rate constant and T is temperature. The straight line BC has slope tan theta=1/2.303 and an intercept of 5 on y-axis. Thus E_(a) the energy of activation is ………………………Cal.
View SolutionK represents the rate constant of a reaction when logK is plotted against 1/T (T= temperature) the graph obtained is a
View Solution
