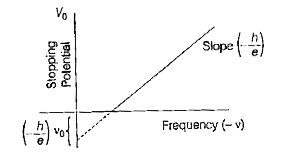
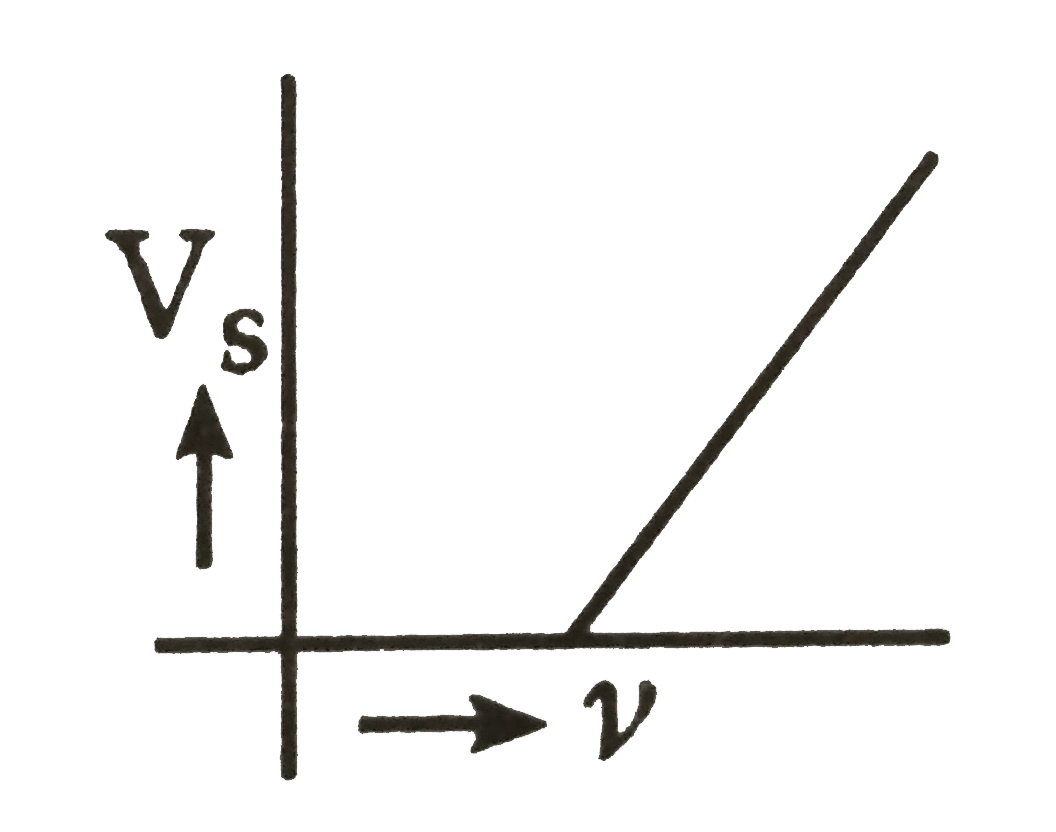
The graph between cut-off potential and frequency of incident radiation in photoelectric effect is
a straight line passing through the origin
a straight line not passing through the origin
a circle
an ellipse
A straight line not passing through the origin.

Similar Questions
In photoelectric effect the slope of stop of stopping potential versus frequency of incident light for a given surface will be
View SolutionDraw and explain the graph showing the variation of stopping potential with frequency of incident radiation in relation to photoelectric effect.
View SolutionDefine photoelectric effect. Draw a graph to show the variation of stopping potential with frequency of incident radiation on a metal plate.
View SolutionExplain effect of frequency of incident radiation in th experiment of photoelectric effect.
View SolutionThe graph between cut-off potential and frequency of incident radiations in photo-electric effect is
View SolutionGraph of incident freuency with stopping potential in photoelectric effect is
View SolutionIn photoelectric effect the slope of straight line graph between stopping potential (Vs) and frequency of incident light (v) gives

View Solution

