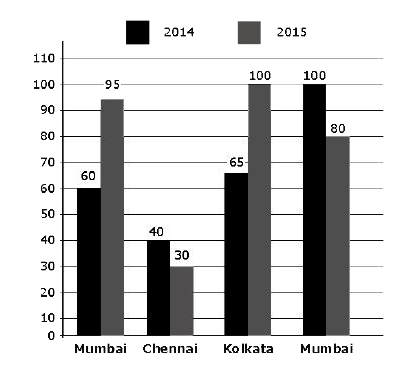
The given bar chart shows the sales of books in four metro branches of a company for the years 2014 and 2015.

In the given bar chart, calculate the percentage increment of sales between the year 2014 and 2015.
14.5
13.7
0.149
0.151
Step by step video solution for The given bar chart shows the sales of books in four metro branches of a company for the years 2014 and 2015. In the given bar chart, calculate the percentage increment of sales between the year 2014 and 2015. by Maths experts to help you in doubts & scoring excellent marks in Class 14 exams.
Updated on:21/07/2023Topper's Solved these Questions
Similar Questions
The graphs of the equations 3x+y-5=0 and 2x-y-5=0 intersect at the point P(α,β). What is the value of (3α+β) ?
समीकरण 3x+y-5=0 तथा 2x-y-5=0 के आरेख एक बिंदु P(α,β) पर एक-दूसरे को काटते है (3α+β) का मान क्या है ?
View SolutionAfter giving two successive discounts, each of x%, on the marked price of an article, total discount is Rs. 259.20. If the marked price of the article is Rs. 720, then the value of x is :
View SolutionThe given bar chart shows the sales of books in four metro branches of a company for the years 2014 and 2015. In the given bar chart, which branch has the highest increase in sale in 2015 as compared to 2014?
View SolutionThe given bar chart shows the sales of books in four metro branches of a company for the years 2014 and 2015. In the given bar chart, calculate the percentage increment of sales between the year 2014 and 2015.
View SolutionThe given bar chart shows the sales of books in four metro branches ofa company for the years 2014 and 2015 In the given bar chart the ratio the total sales between Mumbai and Delhi is
View SolutionThe given bar chart shows production of steel by companies A , B , C and D for years 2014 ,2015, 2016 In the given pie chart, the average production of steel at C for the year 2014-2016 is:
View SolutionThe given bar chart shows production of steel by companies A , B , C and D for years 2014 ,2015, 2016 In the given pie chart,what is the percentage production of B in 2014 to the total production of 2014.
View SolutionThe given bar chart shows the sales of books from six branches of a publishing company during two consecutive years 2000 and 2001. In the given bar chart, the ratio of total sales of all branches for the year 2000 to 2001 is:
View SolutionThe given bar graph shows the sales (in thousands) of books in four metropolitan branches of a company for the years 2014 and 2015. In the given bar graph, which branch has the maximum increase (in %) in sales in 2015 as compared to 2014?
View SolutionThe given bar graph shows the sales (in thousands) of books in four metropolitan branches of a company for the years 2014 and 2015. In the given bar graph, calculate the percentage increase in sales (rounded off to a decimal) during the years 2014 and 2015.
View SolutionThe given bar graph shows the sales (in thousands) of books in the bar metropolitan branches of a company for the years 2014 and 2015. In the given bar graph, the ratio of total sales between Mumbai and Delhi is
View SolutionThe given bar chart shows the production of steel by companies A, B, C and D for the years 2014, 2015, 2016 (in tonnes). In the given bar-chart, the average production of steel in company 'C' for the year 2014 -2016 is
View SolutionThe given bar chart shows the production of steel by companies A, BC and D for the years 2014, 2015, 2016 (in tonnes). In the given bar-chart, what is the percentage of 'B' in 2014 to the total production in 2014?
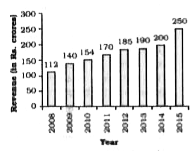
View SolutionThe bar chart given below shows the revenue (in Rs. crores) of company A for the years 2008 to 2015.

The revenue in 2015 is what per cent of the revenue in 2014?
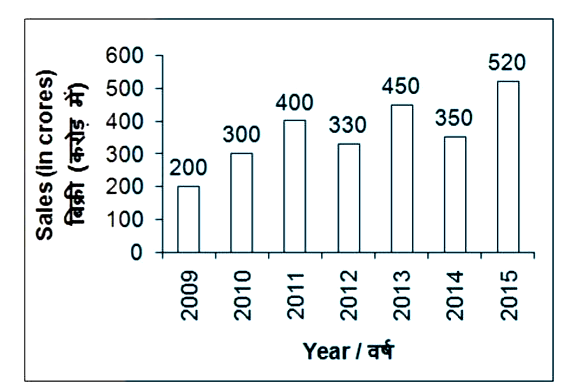
View SolutionThe bar chart given below shows the sales ( in crores) of company P from years 2009 to 2015.

What is the percentage change in sales from year 2010 to 2014?
View SolutionThe bar chart given below shows the sales ( in crores ) of company P from years 2009 to 2015 . (##SSC_MTS_10_OCT_17_I_E01_048_Q01.png" width="80%"> What is the average sale (in crores) from year 2009 to 2013?
View Solution