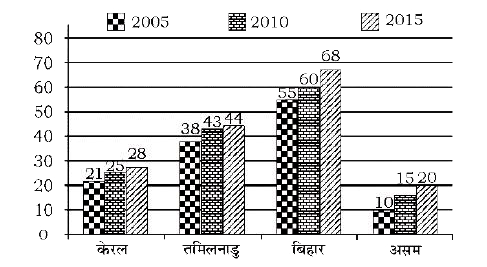
The given bar chart shows population of 4 different states in 3 years

In the given bar chart, what is the ratio of increase in population in Bihar between 2005 and 2010 to that between 2010 and 2015
5:8
3:7
8:5
7:3
Step by step video solution for The given bar chart shows population of 4 different states in 3 years In the given bar chart, what is the ratio of increase in population in Bihar between 2005 and 2010 to that between 2010 and 2015 by Maths experts to help you in doubts & scoring excellent marks in Class 14 exams.
Updated on:21/07/2023Topper's Solved these Questions
Similar Questions
The graphs of the equations 3x+y-5=0 and 2x-y-5=0 intersect at the point P(α,β). What is the value of (3α+β) ?
समीकरण 3x+y-5=0 तथा 2x-y-5=0 के आरेख एक बिंदु P(α,β) पर एक-दूसरे को काटते है (3α+β) का मान क्या है ?
View SolutionAfter giving two successive discounts, each of x%, on the marked price of an article, total discount is Rs. 259.20. If the marked price of the article is Rs. 720, then the value of x is :
View SolutionDetermine the point of symmetry of a regular hexagon.
View SolutionDtermine the images of the following figure about the given line :
View SolutionMatch the following Column A to Column B

View SolutionMatch the following Column A to Column B

View SolutionMatch the following Column A to Column B

View SolutionFind the area of the figure given below.

View SolutionThe area of the shaded part in the figure given below is ______.

View SolutionThe inequation represented by the graph given below is :
View SolutionThe inequation that best describes the graph given below is _________
View SolutionThe inequation that best describes the following graph is _________
View SolutionWhich inequations represent the shaded region in the given figure
View SolutionIn the given figure, PQRS is a parallelogram. A and B are the mid-point of ¯¯¯¯¯¯PQ and ¯¯¯¯¯SR respectively. If PS=BR, then the quadrilateral ADBC is a…………………… ,
ltimg src="https://d10lpgp6xz60nq.cloudfront.net/physics_images/PS_MATH_IX_C12_E05_020_Q01.png" width="80%"gt
View SolutionThe given bar chart shows population of 4 different states in 3 years In the given bar chart, what is the ratio of increase in population in Bihar between 2005 and 2010 to that between 2010 and 2015
View SolutionThe given bar chart shows population of 4 different states in 3 years In the given bar chart, what is the population growth in total in states kerala and tamil nadu for the period between 2005 and 2015?
View Solution