The given bar graph represents the number of students admitted in four schools (S1, S2, S3, S4) during two consecutive years 2017 and 2018.
दिया गया दंड आरेख चार स्कूलों (S1, S2, S3, S4) में लगातार दो साल 2017 और 2018 के दौरान नामांकित
छात्रों की संख्या को प्रदर्शित करता है।
 What is the average number of students admitted to all schools in 2018?
2018 में सभी स्कूलों में दाख़िला लेने वाले छात्रों की औसत संख्या कया है?
290
280
275
270
Step by step video solution for The given bar graph represents the number of students admitted in four schools (S1, S2, S3, S4) during two consecutive years 2017 and 2018. दिया गया दंड आरेख चार स्कूलों (S1, S2, S3, S4) में लगातार दो साल 2017 और 2018 के दौरान नामांकित छात्रों की संख्या को प्रदर्शित करता है। What is the average number of students admitted to all schools in 2018? 2018 में सभी स्कूलों में दाख़िला लेने वाले छात्रों की औसत संख्या कया है? by Maths experts to help you in doubts & scoring excellent marks in Class 14 exams.
Updated on:21/07/2023Topper's Solved these Questions
Similar Questions
The graphs of the equations 3x+y-5=0 and 2x-y-5=0 intersect at the point P(α,β). What is the value of (3α+β) ?
समीकरण 3x+y-5=0 तथा 2x-y-5=0 के आरेख एक बिंदु P(α,β) पर एक-दूसरे को काटते है (3α+β) का मान क्या है ?
View SolutionAfter giving two successive discounts, each of x%, on the marked price of an article, total discount is Rs. 259.20. If the marked price of the article is Rs. 720, then the value of x is :
View SolutionThe given Bar Graph presents the results in terms of number of students for the five academic years, 2013-2014 to 2017-2018. दिया गया दंड आरेख पांच शैक्षणिक वर्षों : 2013-2014 से 2017-2018 तक छात्रों की संख्या के संदर्भ में परिणामों को प्रस्तुत करता है | What is the average of failed students in five academic years? पांच शैक्षणिक वर्षों में असफल छात्रों का औसत कया है ?
View SolutionThe given Bar Graph presents the number of students of two schools for six years. दिया गया दंड आरेख छः वर्ष की अवधि में दो विद्यालयों में छात्रों की संख्या को दर्शाता है | What is the average number of students from school B during the six year period (correct to two decimal places)? छः वर्षों की अवधि में विद्यालय B के छात्रों की औसत संख्या कितनी रही है? (दशमलव के दो स्थान तक )
View SolutionThe given Bar Graph presents the results in terms of the number of students in a school for the five academic years, 2013-2014 to 2017-2018. दिया गया दंड आरेख पांच शैक्षणिक वर्षों : 2013-2014 से 2017-2018 तक एक विद्यालय में छात्रों की संख्या के संदर्भ में परिणामों को प्रस्तुत करता है | What is the average number of students who passed in the five academic years? पांच शैक्षणिक वर्षों में पास करने वाले छात्रों की औसत संख्या कया है ?
View SolutionThe given Bar Graph presents the results in terms of the number of students in a school for the five academic years, 2013-2014 to 2017-2018. दिया गया दंड आरेख पांच शैक्षणिक वर्षों : 2013-2014 से 2017-2018 तक एक विद्यालय में छात्रों की संख्या के संदर्भ में परिणामों को प्रस्तुत करता है | In which academic year the difference between the number of students passed and that of those failed is the lowest? किस शैक्षणिक वर्ष में, पास करने वाले छात्रों तथा फेल करने वाले छात्रों की संख्या में सबसे कम अंतर है ?
View SolutionThe given Bar Graph presents the results in terms of the number of students in a school for the five academic years, 2013-2014 to 2017-2018. In which year the percentage increase in total number of students is the lowest in comparison to its previous academic year? दिया गया दंड आरेख पांच शैक्षणिक वर्षों : 2013-2014 से 2017-2018 तक एक विद्यालय में छात्रों की संख्या के संदर्भ में परिणामों को प्रस्तुत करता है | किस वर्ष छात्रों की कुल संख्या में प्रतिशत वृद्धि पिछले शैक्षणिक वर्ष की तुलना में सबसे कम है ?
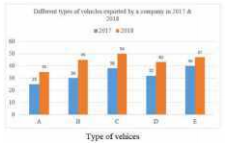
View SolutionThe given Bar Graph presents the number of different types of vehicles exported by a company in 2017 and 2018.The average export of vehicles in 2018 is what percent more than the export of vehicle A in 2017?
दिया गया दंड आरेख एक कंपनी के द्वारा 2017 और 2018 में निर्यात किये गए अलग-अलग प्रकार के वाहनों की संख्या को दर्शाता है |
2018 में वाहनों का औसत निर्यात 2017 में वाहन A के निर्यात से कितना प्रतिशत अधिक है ?
View SolutionThe given bar graph represents the number of students admitted in four schools (S1, S2, S3, S4) during two consecutive years 2017 and 2018.
दिया गया दंड आरेख चार स्कूलों (S1, S2, S3, S4) में लगातार दो साल 2017 और 2018 के दौरान नामांकित छात्रों की संख्या को प्रदर्शित करता है। The ratio between total number of students admitted in the four schools in 2017 to the total
number of students in the four schools in 2018 is:
2017 में चार स्कूलों नामांकित में कुल छात्रों की संख्या और 2018 में चार स्कूलों में नामांकित कुल छात्रों की संख्या के बीच अनुपात है:
View SolutionThe given bar graph represents the number of students admitted in four schools (S1, S2, S3, S4) during two consecutive years 2017 and 2018.
दिया गया दंड आरेख चार स्कूलों (S1, S2, S3, S4) में लगातार दो साल 2017 और 2018 के दौरान नामांकित छात्रों की संख्या को प्रदर्शित करता है। The total number of students admitted in school S3 for both years is approximately what percent of total students admitted in school S2 for both years?
दोनों वर्षों के लिए स्कूल S3 में नामांकित छात्रों की कुल संख्या, दोनों वर्षों के लिए स्कूल S2 में नामांकित कुल छात्रों का कितना प्रतिशत है?
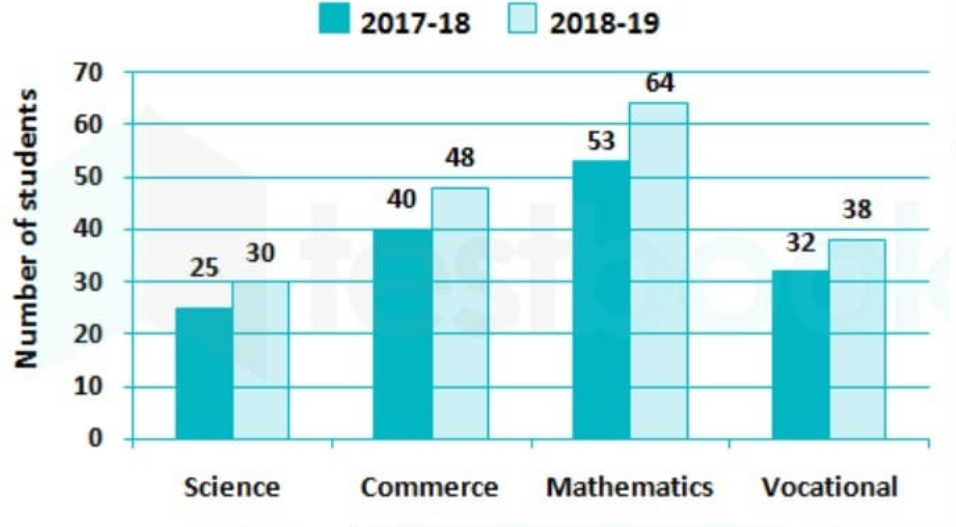
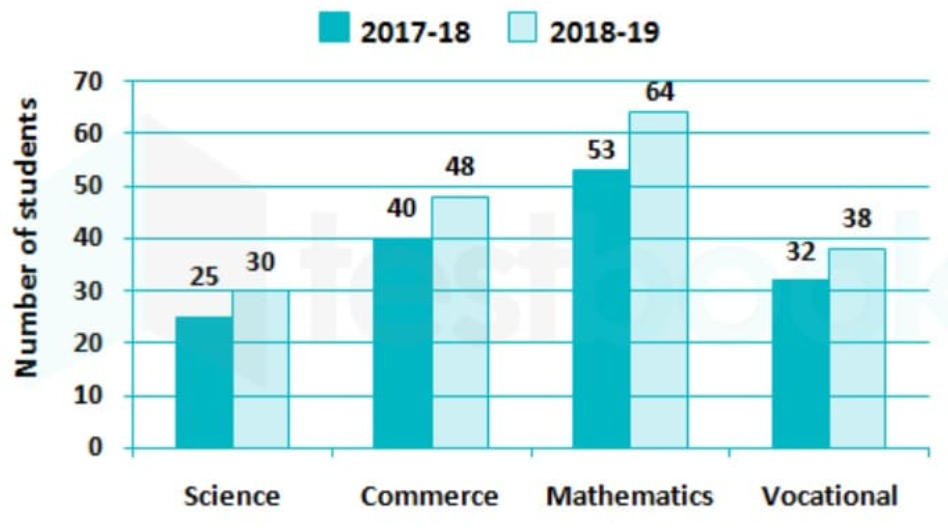
View SolutionThe given bar graph represents the number of students who appeared in the board examination in session 2017-18 and 2018-19. Study the graph and answer the question that follows.
दिया गया दंड आरेख सत्र 2017-18 और 2018-19 सत्र में बोर्ड परीक्षा में उपस्थित होने वाले छात्रों की संख्या को दर्शाता है। आरेख का अध्ययन करें और प्रश्न का उत्तर दें। The difference between the average number of students of Science and Humanities stream in 2017-18 and that in Commerce and Vocational in 2018-19 is:
2017-18 में विज्ञान और मानविकी विषय के छात्रों की औसत संख्या और 2018-19 में वाणिज्य और व्यावसायिक में छात्रों की औसत संख्या के बीच अंतर ज्ञात करे।
View SolutionThe given bar graph represents the number of students who appeared in the board examination in session 2017-18 and 2018-19. Study the graph and answer the question that follows. What is the ratio of the total number of students appeared in examinations in 2017-18 and 2018-19?
दिया गया दंड आरेख सत्र 2017-18 और 2018-19 सत्र में बोर्ड परीक्षा में उपस्थित होने वाले छात्रों की संख्या को दर्शाता है। आरेख का अध्ययन करें और प्रश्न का उत्तर दें।
2017-18 और 2018-19 में परीक्षा में उपस्थित हुए छात्रों की कुल संख्या का अनुपात कया है ?
View SolutionThe given bar graph represents the number of students who appeared in the board examination in session 2017-18 and 2018-19. Study the graph and answer the question that follows. What percentage is the total number of students who appeared in 2017-18 is less than the total number of students who appeared in 2018-19?(correct to one decimal place)
दिया गया दंड आरेख सत्र 2017-18 और 2018-19 सत्र में बोर्ड परीक्षा में उपस्थित होने वाले छात्रों की संख्या को दर्शाता है। आरेख का अध्ययन करें और प्रश्न का उत्तर दें।
2017-18 में उपस्थित होने वाले छात्रों की कुल संख्या 2018-19 में उपस्थित होने वाले कुल छात्रों (एक दशमलव हा तक) से कितने प्रतिशत कम है?
View SolutionThe given bar graph shows the number of students of two schools over a period of six years
दिया गया दंड आरेख में छह साल की अवधि में दो स्कूलों के छात्रों की संख्या को दर्शाता है।
In the bar graph, in which year is the sum of the students from schools A and B taken together is minimum ?
दंड आरेख में, A और B स्कूलों के छात्रों का योग किस वर्ष में न्यूनतम है?
View SolutionThe given bar graph presents the results in terms of number of students in a school for the 5 academic years, 2013-2014 to 2017-2018. दिया गया दंड आरेख ( बार ग्राफ) 5 शैक्षणिक वर्षो, 2013-2014 से 2017-2018, के दौरान किसी स्कूल के परीक्षाफल को विद्यार्थियों की संख्या के रूप में दर्शाता है| what is the average of failed students in five academic years? 5 शैक्षणिक वर्षों में अनुत्तीर्ण हुए विद्यार्थियों का औसत क्या है?
View Solution
