Study the pie-chart and the table carefully and answer the questions that follow. The percentage distribution of lecturers in five different subjects in a university is shown in the pie-chart. The total number of lecturers is 500.
पाई-चा्ट और तालिका का ध्यानपूर्वक अध्ययन करें और आने वाले प्रश्नों के उत्तर दें। एक विश्वविद्यालय में पांच अलग-अलग विषयों में व्याख्याताओं का प्रतिशत वितरण पाई-चार्ट में दिखाया गया है। व्याख्याताओं की कुल संख्या 500 है।
 Ratio of male to female lecturers:
महिला व्याख्याताओं और पुरुष व्याख्याताओं का अनुपात:
 What is the difference in the number of female lecturers in chemistry and Mathematics?
रसायन विज्ञान और गणित में महिला व्याख्याताओं की संख्या में क्या अंतर है?
30
22
20
25
Step by step video solution for Study the pie-chart and the table carefully and answer the questions that follow. The percentage distribution of lecturers in five different subjects in a university is shown in the pie-chart. The total number of lecturers is 500. पाई-चा्ट और तालिका का ध्यानपूर्वक अध्ययन करें और आने वाले प्रश्नों के उत्तर दें। एक विश्वविद्यालय में पांच अलग-अलग विषयों में व्याख्याताओं का प्रतिशत वितरण पाई-चार्ट में दिखाया गया है। व्याख्याताओं की कुल संख्या 500 है। Ratio of male to female lecturers: महिला व्याख्याताओं और पुरुष व्याख्याताओं का अनुपात: What is the difference in the number of female lecturers in chemistry and Mathematics? रसायन विज्ञान और गणित में महिला व्याख्याताओं की संख्या में क्या अंतर है? by Maths experts to help you in doubts & scoring excellent marks in Class 14 exams.
Updated on:21/07/2023Topper's Solved these Questions
Similar Questions
Study the given pie-chart and table carefully and answer the question that follows. The percentage wise distribution of lecturers in five different subjects in a university is shown in the pie-chart. The total number is 500.
दिए गए पाई-चार्ट और तालिका का सावधानीपूर्वक अध्ययन करें और उसके बाद प्रश्नों का उत्तर दें। एक विश्वविद्यालय में पांच अलग-अलग विषयों में व्याख्याताओं का प्रतिशतवार वितरण पाई-चार्ट में दिखाया गया है। कुल संख्या 500 है। Ratio of male to female lecturers:
महिला व्याख्याताओं और पुरुष व्याख्याताओं का अनुपात: Find the number of male lecturers in Physics.
भौतिकी में पुरुष व्याख्याताओं की संख्या ज्ञात कीजिए।
View SolutionStudy the given pie-chart and table carefully and answer the question that follows. The percentage-wise distribution of lecturers in five different subjects in a university is shown in the pie-chart. The total number of lecturers is 500.
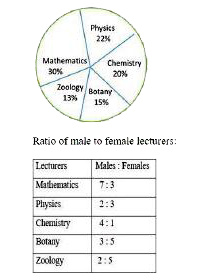
Find the number of male lecturers in Physics.
View SolutionReading of pie chart for the % wise distribution of lectures in different subjects
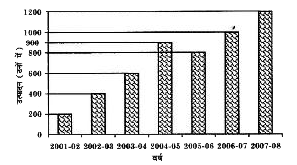
View SolutionStudy the chart carefully and answer the questions.
The chart shows production of an item (in tones) during certain years.
The production in 2006-07 in comparison to the production in 2002-03 increased by.
निम्न आरेख का ध्यानपूर्वक अध्ययन कर दिए गए प्रश्नों के उत्तर दें:
आरेख किसी वर्ष के दौरान एक मद का उत्पादन (टनों में) दर्शाता है।
वर्ष 2002-03 की तुलना में 2006-07 में उत्पादन में वृद्धि हुई -
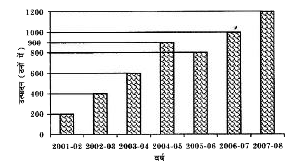
View SolutionStudy the chart carefully and answer the questions.
The chart shows production of an item (in tones) during certain years.
The production decreased from 2004-05 to 2005 - 06 by
निम्न आरेख का ध्यानपूर्वक अध्ययन कर दिए गए प्रश्नों के उत्तर दें:
आरेख किसी वर्ष के दौरान एक मद का उत्पादन (टनों में) दर्शाता है।
वर्ष 2004-05 से 2005-06 में उत्पादन में कितनी कमी हुई ?
View SolutionStudy the following pie chart and table to answer the question.Total number of students admitted in a university in various fields = 5000 Distribution of the number of students into various fields:
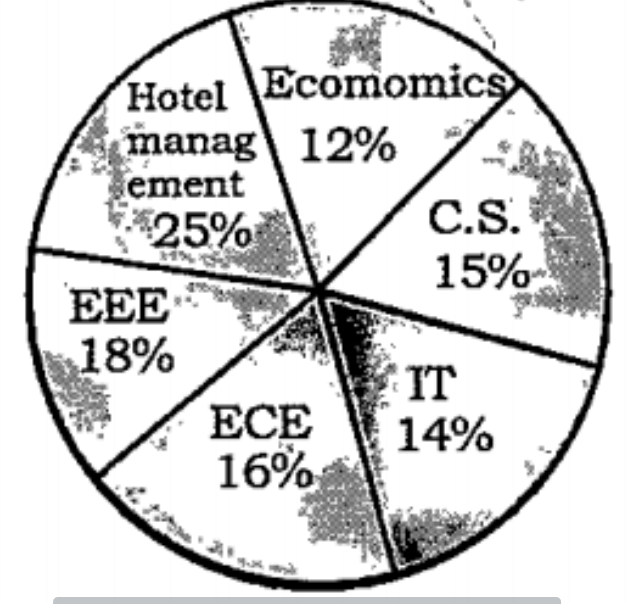
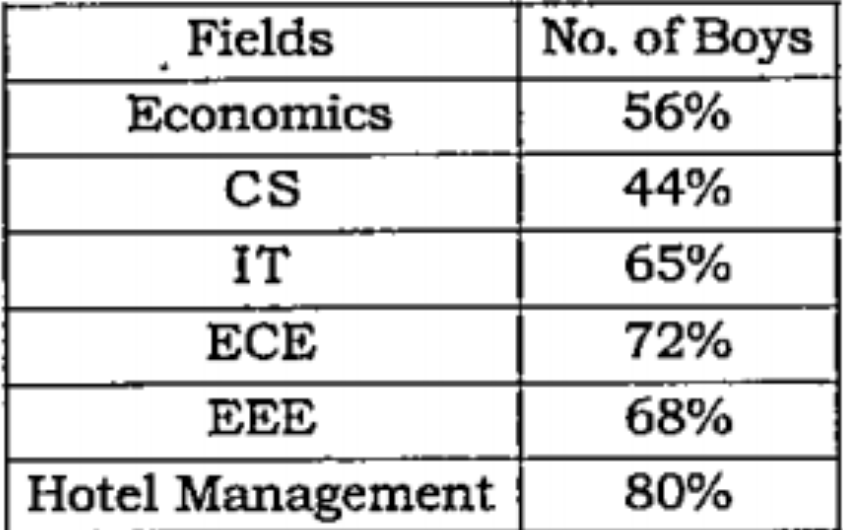 What is the average number of boys in CS, ECE and EEE fields?
निम्नांकित पाई चार्ट का अध्ययन कीजिए और उसके बाद दिए गए प्रशन का उत्तर दीजिए। एक विश्वविद्यालय में विभिन्न संकायों में प्रवेश लेने वाले विद्यार्थियों की संख्या 5000 है। विभिन्न संकायों में विद्यार्थियों को संख्या का बंटनः
CS, ECE और EEE संकायों में लड़कों की औसत संख्या कितनी है?
View SolutionStudy the chart and answer the questions:
In which of the given years is the percentage increase in the number of hotels in comparison to the previous year, is the maximum?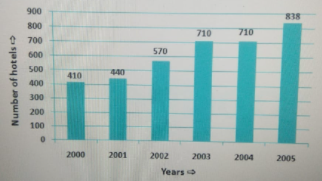
चार्ट का अध्ययन करें और प्रश्नों का उत्तर दें:पिछले वर्ष की तुलना में होटलों की संख्या में किस वर्ष में अधिकतम प्रतिशत वृद्धि हुई है?
View SolutionStudy the pie-chart and answer the questions. In an institute, there are 900 students who use different modes of transport for to and from travel. The given pie diagram represents the requisite data.
पाई-चार्ट का अध्ययन करें और प्रश्नों के उत्तर दें। एक संस्थान में, 900 छात्र हैं जो आने-जाने के लिए परिवहन के विभिन्न साधनों का उपयोग करते हैं। दिए गए पाई चार्ट में संबंधित आंकड़े दिए गए हैं।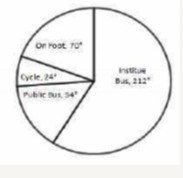 The number of students who travel on foot is:
पैदल यात्रा करने वाले छात्रों की संख्या है:
View SolutionStudy the pie-chart and answer the questions:
Break up (degree wise) of students in terms of specialization in different areas(A, B, C, D & E) in an MBA program.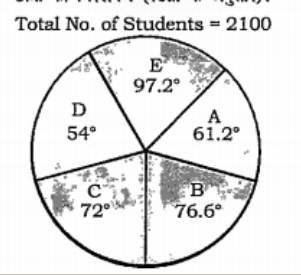
The number of students specialising in E is what percent more than that of students specialising in C?
पाई-चार्ट का अध्ययन करें और प्रश्नों के उत्तर दें: एमबीए प्रोग्राम में विभिन्न क्षेत्रों (ए, बी, सी, डी एंड ई) में विशेषज्ञता के मामले में छात्रों का ब्रेक अप (डिग्री वार)।

E में विशेषज्ञता प्राप्त छात्रों की संख्या C में विशेषज्ञता वाले छात्रों से कितने प्रतिशत अधिक है?
View SolutionThe given Pie Chart (central angles are not as per any chosen scale) presents 116 percentage of the number of refrigerators of five different companies (with reference to the total number of refrigerators) in a hotel.
दिया गया पाई-चार्ट ( केंद्रीय कोण किसी भी चयनित पैमाने के अनुसार नहीं हैं ) किसी होटल में पांच अलग-अलग कंपनियों के रेफ्रिजिरेटरों की संख्या का प्रतिशत (रेफ्रिेजिरिटरों की कुल संख्या के संदर्भ में ) दर्शाता है |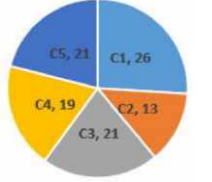 What is the difference in number of refrigerators supplied to the hotel by companies C1 and C5?
कंपनी C1 एवं C5 के द्वारा होटल को आपूर्ति किये गए रेफ्रिजिरेटरों की संख्या में क्या अंतर है ?
View Solution