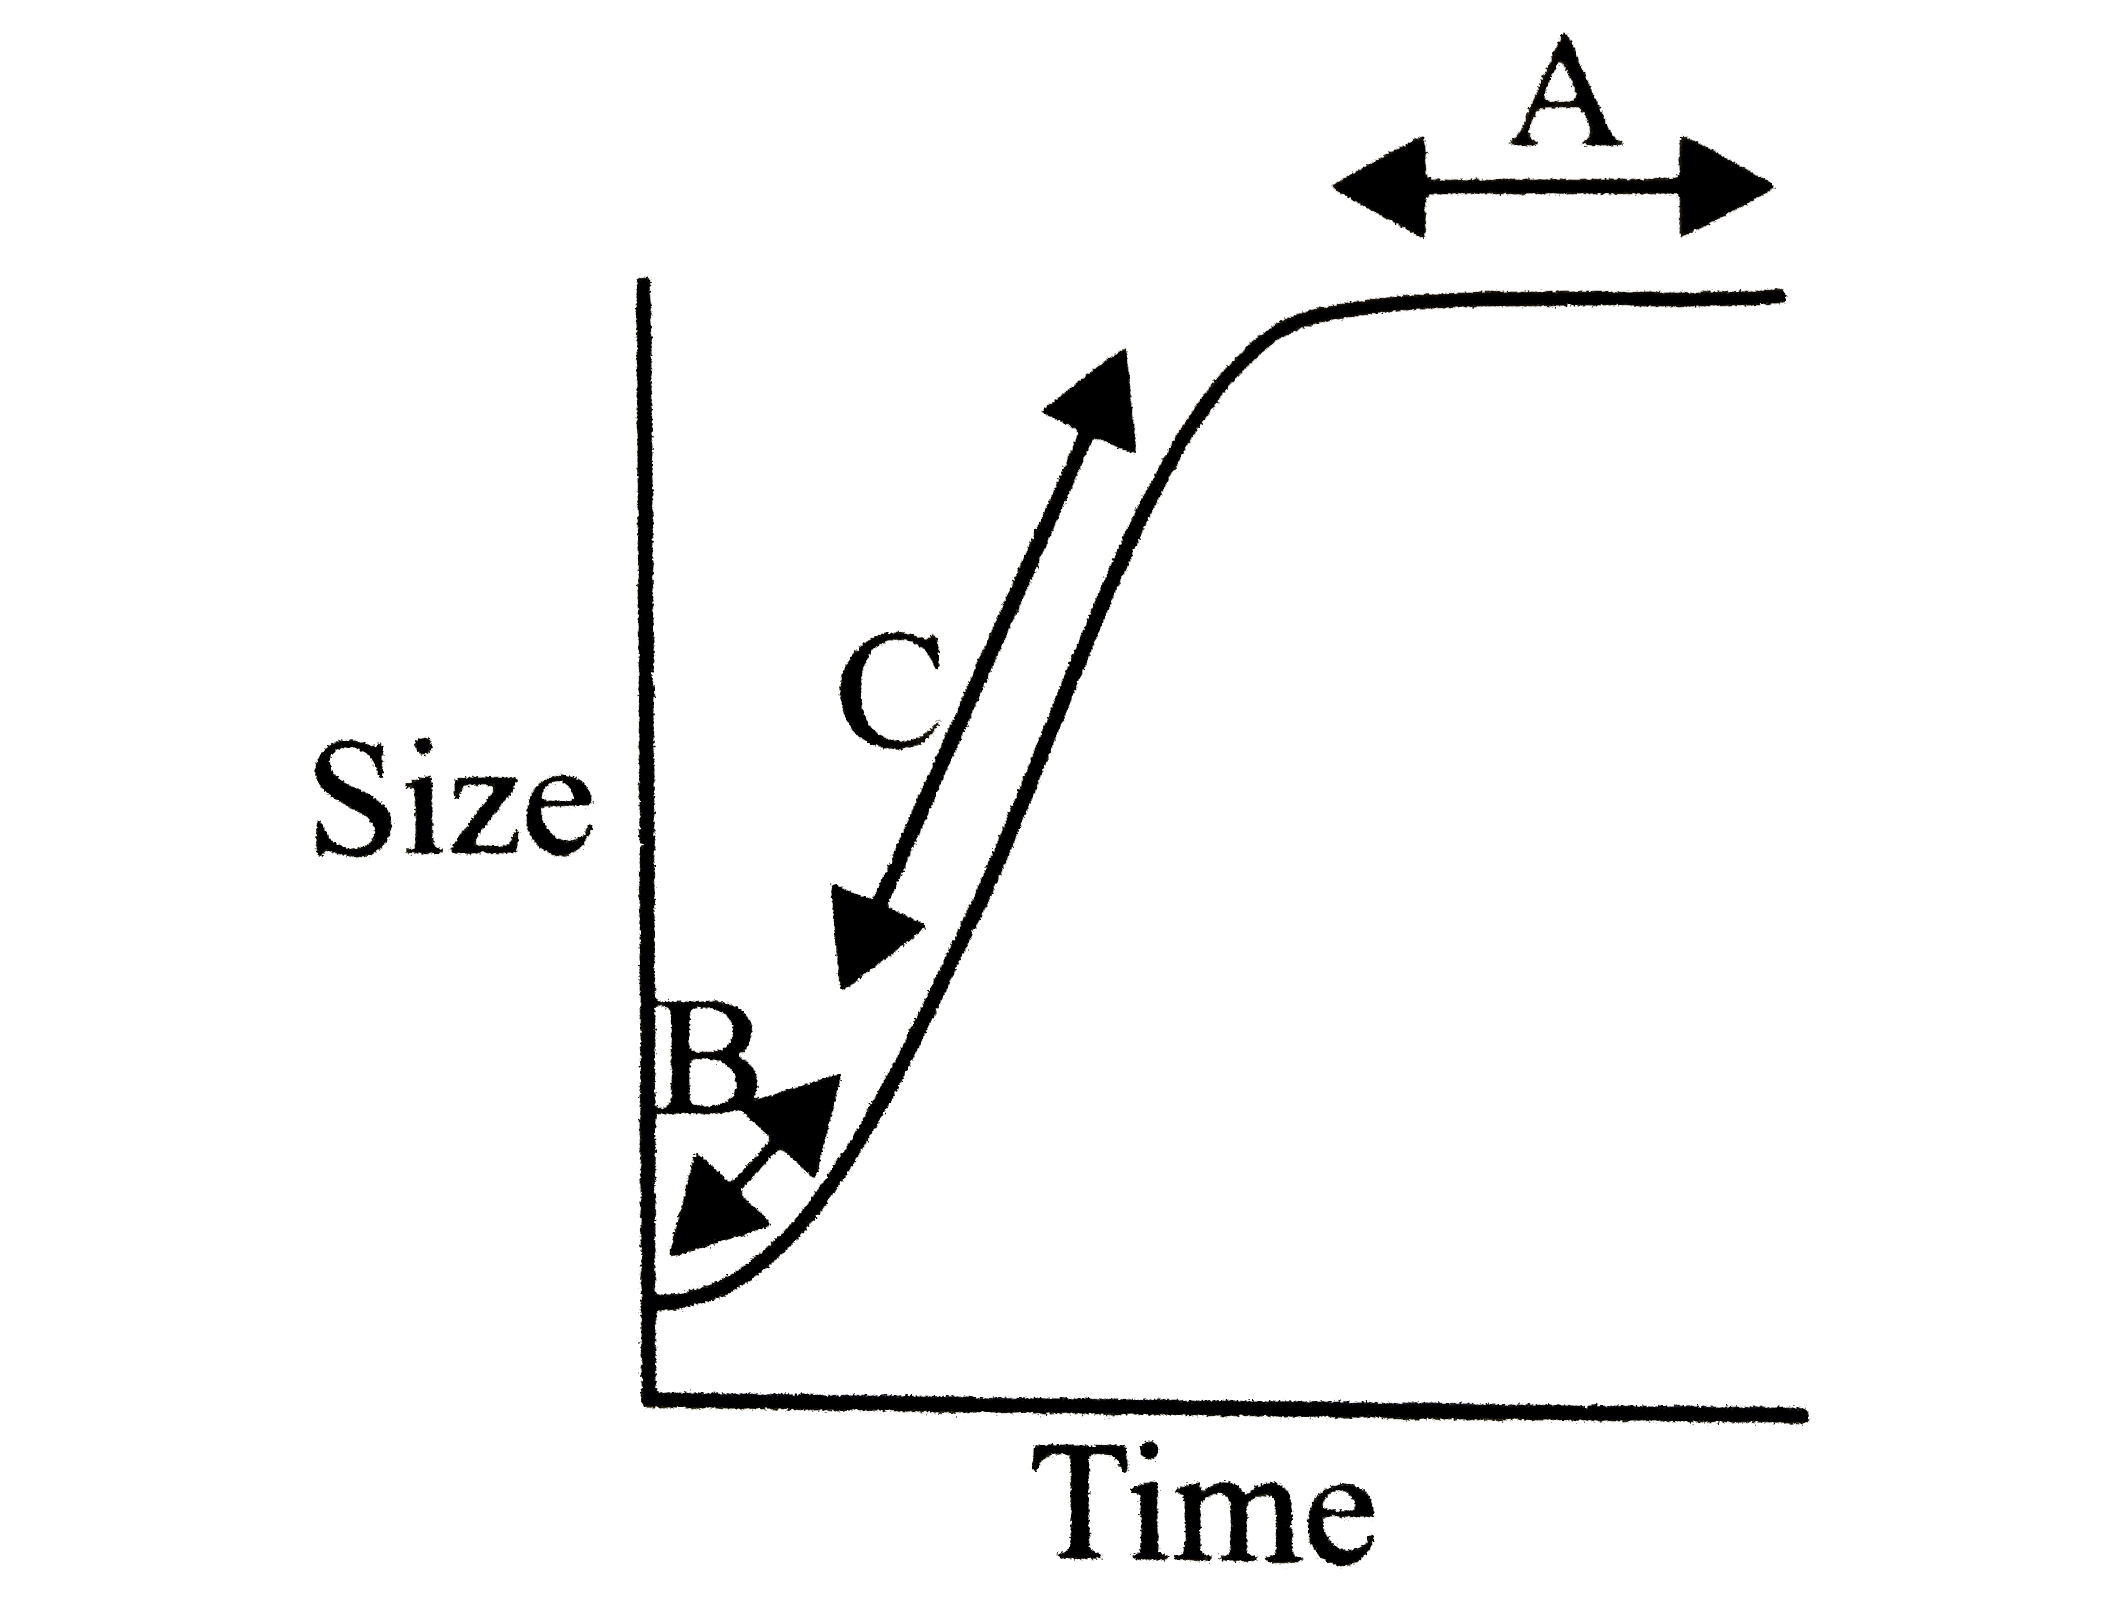
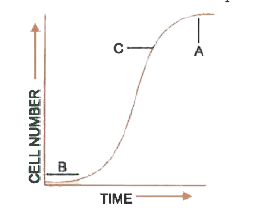
Given graph is drawn on the parameters of growth versus time. Here A,B and C respetively represent

Exponential phase, lag phase and steady state phase
Steady state phase, lag phase and log phase
Slow growing phase, lag phase, steady state phase
Log phase lag phase and steady state phase.
The correct Answer is:B
Step by step video solution for Given graph is drawn on the parameters of growth versus time. Here A,B and C respetively represent by Biology experts to help you in doubts & scoring excellent marks in Class 12 exams.
Updated on:21/07/2023Topper's Solved these Questions
- Plant Growth and MovementsBOOK - DINESH PUBLICATION ENGLISHCHAPTER - Plant Growth and MovementsEXERCISE - CYG
20 Videos
- Plant Growth and MovementsBOOK - DINESH PUBLICATION ENGLISHCHAPTER - Plant Growth and MovementsEXERCISE - BRAIN TEASERS-IV
41 Videos
- Plant Growth and MovementsBOOK - DINESH PUBLICATION ENGLISHCHAPTER - Plant Growth and MovementsEXERCISE - BRAIN TEASERS-IV
41 Videos
- PLANT BREEDING AND DISEASE CONTROLBOOK - DINESH PUBLICATION ENGLISHCHAPTER - PLANT BREEDING AND DISEASE CONTROLEXERCISE - Check your Grasp
10 Videos
- PLATYHELMINTHES-THE FLAT WORMSBOOK - DINESH PUBLICATION ENGLISHCHAPTER - PLATYHELMINTHES-THE FLAT WORMSEXERCISE - check your grasp
9 Videos
Similar Questions
Progressive or sequential senescence is shown by
View SolutionA characteristic based on concentration of particles in solution is
View SolutionA characteristic based on concentration of particles in solution is
View SolutionMultiple shoot culture requires
View SolutionBinary fission occurs in metazoan in
View SolutionIf a graph is drawn for acceleration versus displacemnet of SHM. It is a
View SolutionThe graph below shws the velocity versus time graph for a body

Which of the following graph represents the corresponding acceleration v//s time graph?
View SolutionGiven graph is drawn on the parameters of growth versus time. Here A,B and C respectively represent

View SolutionThe graph given below represents changes in different ecological parameters due to effluent mixing in a stream. The three lines A, B anc C represent

View SolutionGiven below is a graph on the parametes of growth versus time A,B , C respectively represent
View SolutionIn the given velocity (V) versus time (t) graph, accelerated and decelerated motions are respectively represented by line segments
View SolutionThe graph in figure shows the velocity v versus time t for a body. Which of the graphs shown in figure represents the correesponding acceleration versus time graphs ?
View SolutionGiven below is a graph drawn on the parameters of growth versus time A,B and C respectively represent.

View SolutionGiven graph is drawn on the parameters of growth versus time. Here A,B and C respetively represent

View SolutionThe graph given below represents changes in different ecological parameters due to effluent mixing in a stream. The three lines A, B anc C represent

View SolutionThe graph below shws the velocity versus time graph for a body Which of the following graph represents the corresponding acceleration v//s time graph?
View Solution

