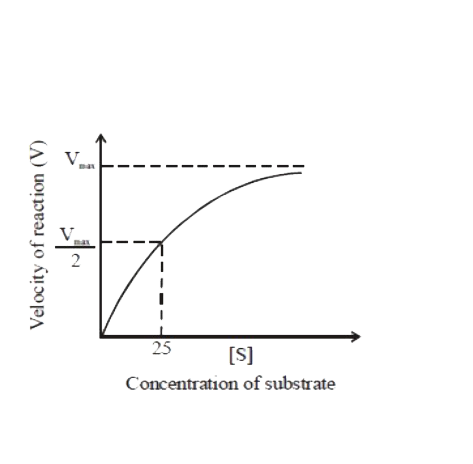
What does the graph indicate ?
The graph given below shows the effect of substrate concentration on the rate of reaction of the enzyme green- gram-phos-phatase.
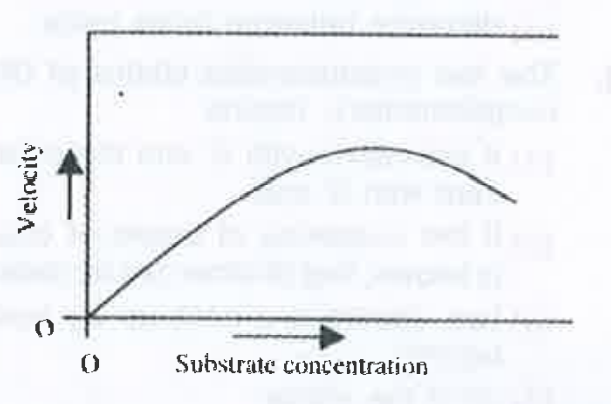
Formation of enzyme substrate complex
Increase of pH at higher concentration of substrate
presence of enzyme inhibitor
Rate of reaction is directly proportional to substrate concentration.
The correct Answer is:C
Step by step video solution for What does the graph indicate ? The graph given below shows the effect of substrate concentration on the rate of reaction of the enzyme green- gram-phos-phatase. by Biology experts to help you in doubts & scoring excellent marks in Class 12 exams.
Updated on:21/07/2023Topper's Solved these Questions
- MOLECULES OF THE CELLBook:DINESH PUBLICATION ENGLISHChapter:MOLECULES OF THE CELLExercise:CYG
Explore 43 Videos
- MOLECULES OF THE CELLBook:DINESH PUBLICATION ENGLISHChapter:MOLECULES OF THE CELLExercise:CYG
Explore 43 Videos
- MICROBES IN HUMAN WELFAREBook:DINESH PUBLICATION ENGLISHChapter:MICROBES IN HUMAN WELFAREExercise:Brain Teasers-VIII
Explore 60 Videos
- MOLLUSCABook:DINESH PUBLICATION ENGLISHChapter:MOLLUSCAExercise:CYG
Explore 10 Videos
Similar Questions
Immediate source of energy is
View SolutionImmediate source of energy is
View SolutionHuman society started use of bronze/copper
View SolutionSiphuncle or living tube occurs in
View SolutionThe given graph shows the effect of substrate concentration on the rate of reaction of the enzyme green gram-phosphatase

What dose the graph indicate
View SolutionThe given graph shows the effect of substrate concentration on the rate of reaction of the enzymes green gram-phosphatase. What does the graph indicate ?
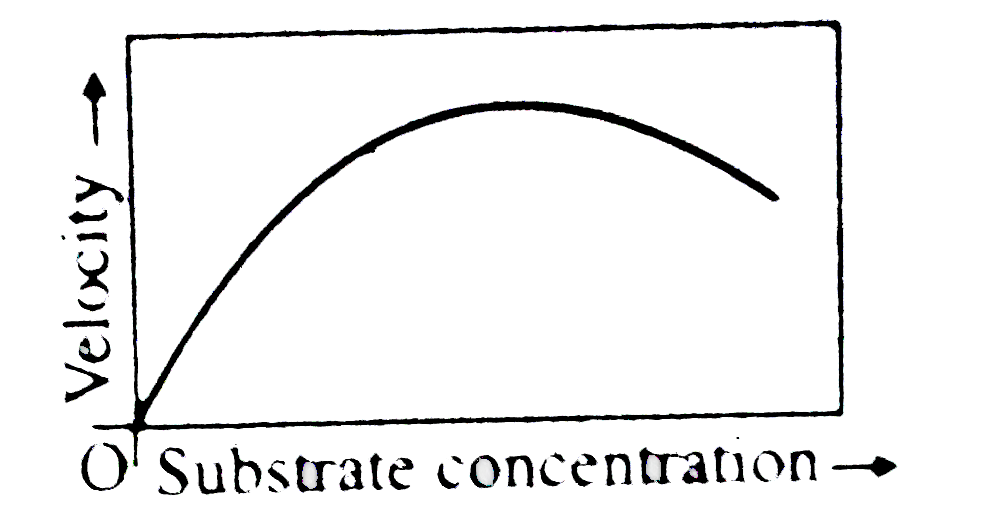
View Solutionthe graph given in Fig.9.36 shows the effect of substrate concentration on the rate of reaction of the enzyme green-gram -phosphatase . What does the graph indicates ?
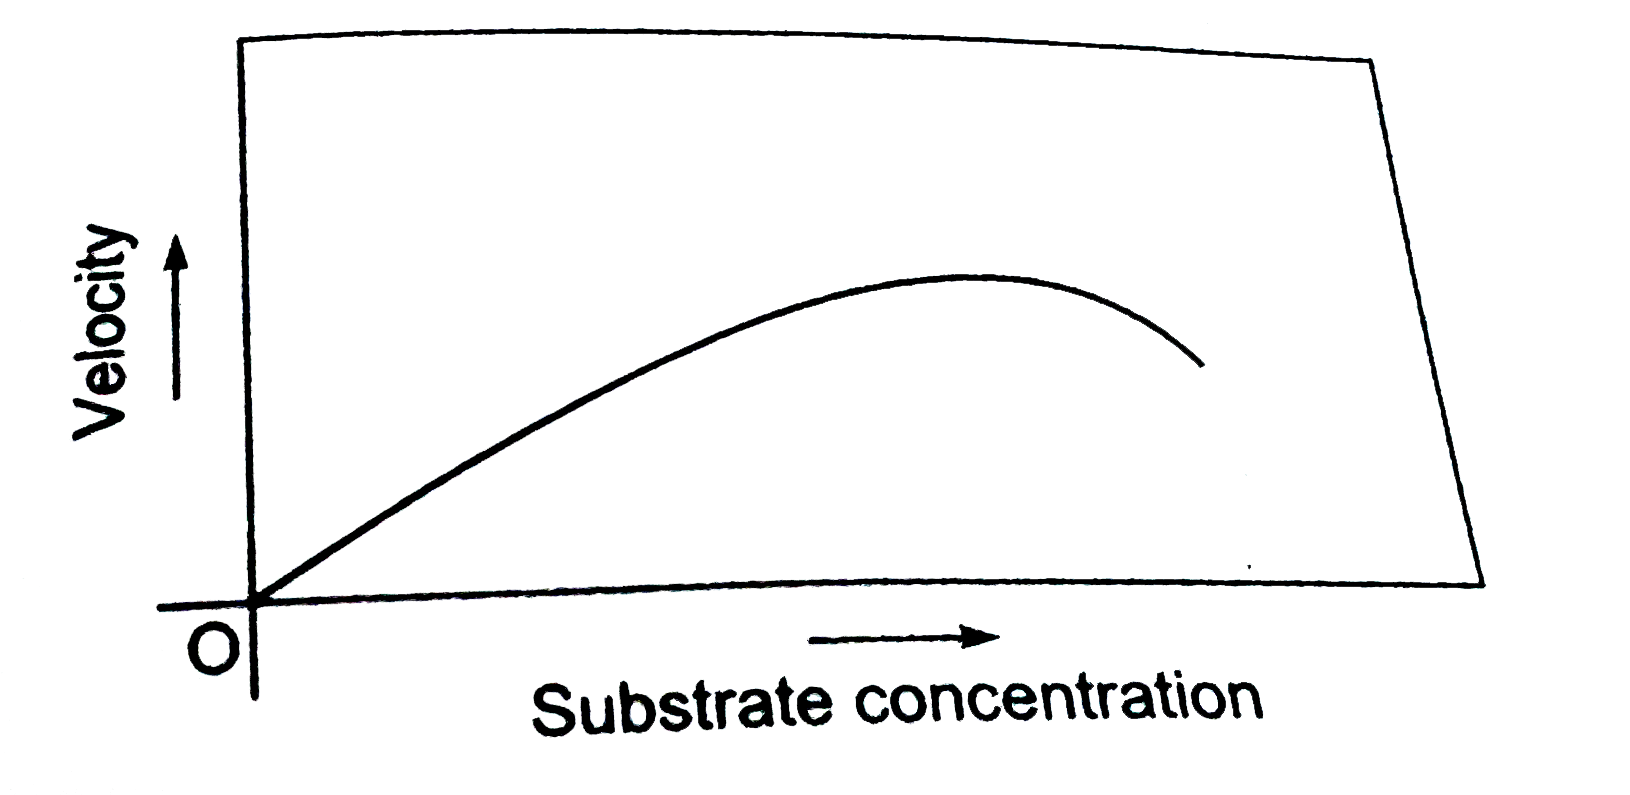
View SolutionThe given graph shows the effect of substrate concentration on the rate of reaction of the enzyme green-gram-phosphatase What does the graph indicate?
View SolutionThe graph given below shows the effect of substrate concentration on the rate of reaction of the enzyme green-gram-phosphatase What does the graph indicates?
View SolutionFollowing graphs show the effect of change in concentration of substrate on enzyme activity:
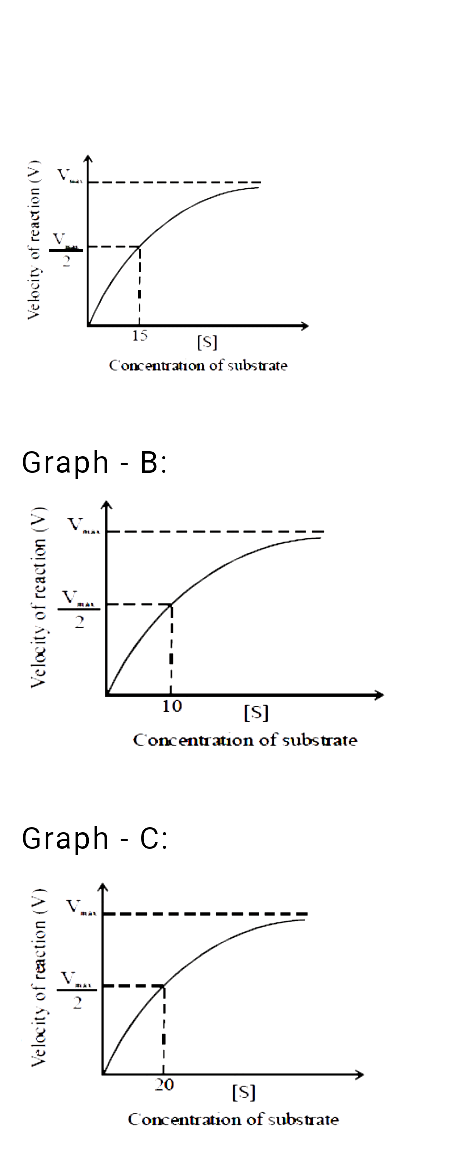
In which of the above curve,the enzyme shows maximum substrate affinity
View SolutionWhat is denoted by X and Y in the given graph?
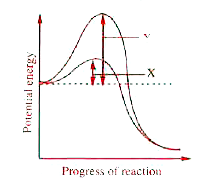
XY1) Activation energy without enzymeActivation energy with enzyme2) Activation energy with enzyme Activation energy without enzyme3) Substrate concentration with enzymeSubstrate concentration without enzyme4) Substrate concentration without enzymeSubstrate concentration with enzyme
View Solutionटिटेनस रोग का कारक कौन है ?
View SolutionBased on the graph given below, explain the effect of concentration of substrate on enzyme activity.
View SolutionThe given graph is showing the relationship between the rate of enzyme reaction and concentration of substrate. At concentration of substrate greater than X, the
View SolutionWhat does the graph indicate ?
The graph given below shows the effect of substrate concentration on the rate of reaction of the enzyme green- gram-phos-phatase.

View SolutionFollowing graphs show the effect of change in concentration of substrate on enzyme activity: In which of the above curve,the enzyme shows maximum substrate affinity
View Solution
