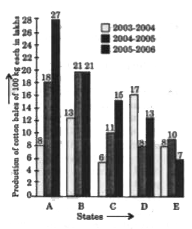
The following graph shows the production of cotton bales of 100 kg each (in lakhs) by different states A, B, C, D and E over the years. Study the graph and answer the following Questions.

How many kg of cotton was produced by State C during the given period ?
32,00,00,000 kg
42,50,00,000 kg
33,00,00,000 kg
35,00,00,000 kg
The correct Answer is:A
Step by step video solution for The following graph shows the production of cotton bales of 100 kg each (in lakhs) by different states A, B, C, D and E over the years. Study the graph and answer the following Questions. How many kg of cotton was produced by State C during the given period ? by Maths experts to help you in doubts & scoring excellent marks in Class 14 exams.
Updated on:21/07/2023Topper's Solved these Questions
- STATISTICS AND DATA INTERPRETATIONBOOK - KIRAN PUBLICATIONCHAPTER - STATISTICS AND DATA INTERPRETATIONEXERCISE - TYPE-V
38 Videos
- STATISTICS AND DATA INTERPRETATIONBOOK - KIRAN PUBLICATIONCHAPTER - STATISTICS AND DATA INTERPRETATIONEXERCISE - TYPE-VI
86 Videos
- STATISTICS AND DATA INTERPRETATIONBOOK - KIRAN PUBLICATIONCHAPTER - STATISTICS AND DATA INTERPRETATIONEXERCISE - TYPE-III
39 Videos
- SIMPLIFICATIONBOOK - KIRAN PUBLICATIONCHAPTER - SIMPLIFICATIONEXERCISE - TEST YOURSELF
25 Videos
- TIME AND DISTANCEBOOK - KIRAN PUBLICATIONCHAPTER - TIME AND DISTANCEEXERCISE - Type -XI
74 Videos
Similar Questions
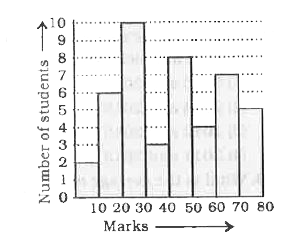
The histogram shows the maeks obtained by 45 students of a class. Look at the histogram and answer the questions.

How many students have obtained marks 50 and above ?
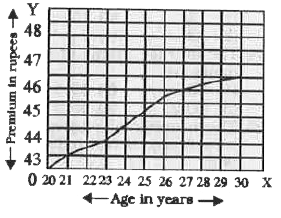
View SolutionThe graph given here shows the annual premiums of an insurance company, charged for an insurance of Rs for individuals of different age-groups. Study the graph and answer each of the following questions : Scale{along O X −−−−−−−−−−−−−−−−−−−−−−−−−−−−−−−−→ 1 small div = 1 yearalong O Y −−−−−−−−−−−−−−−−−−−−−−−−−−−−−−−−→ 1 small div = 50 paise

The annual premium for a man aged 26 years for an insurance of Rs 1000 is
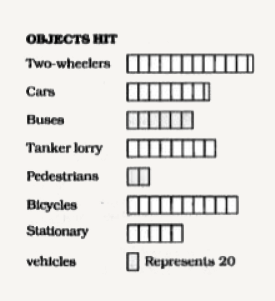
View SolutionThe following is a horizontal bar diagram showing the accidents in which two-wheelers are involved with other objects. Study the diagram and answer the questions.

The difference in percentage between the accidents involving two-wheeler and other objects is respectively.
View SolutionSimplify : 1+11+22+31+45
View SolutionI walk a certain distance and ride back taking a total time of 37 minutes. I could walk both ways in 55 minutes. How long would it take me to ride both ways?
View SolutionHow many lines of symmetry does the above figure have ?
View SolutionDetermine the point of symmetry of a regular hexagon.
View SolutionDtermine the images of the following figure about the given line :
View SolutionMatch the following Column A to Column B

View SolutionMatch the following Column A to Column B

View SolutionMatch the following Column A to Column B

View SolutionThe inequation represented by the graph given below is :
View SolutionThe inequation that best describes the graph given below is _________
View SolutionThe inequation that best describes the following graph is _________
View SolutionWhich of the following statement is not correc for following straight line graph :-
ltimg src="https://d10lpgp6xz60nq.cloudfront.net/physics_images/ALN_PHY_R04_E01_015_Q01.png" width="80%"gt
View SolutionFollowing figure shows P-T graph for four processes A, B, C and D. Select the correct alternative ltimg src="https://d10lpgp6xz60nq.cloudfront.net/physics_images/ALN_PHY_R05_E09_007_Q01.png" width="80%"gt
View Solution
