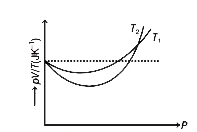
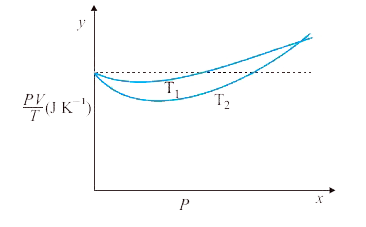
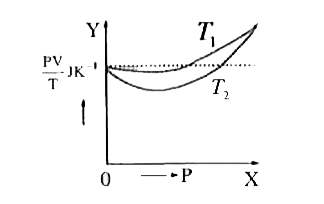
The figure shows the graph of pVT versus p for 2×10⁻⁴ kg of hydrogen gas at two different temperatures, where p,V andT represents pressure, volume and temperature respectively. Then, the value of pVT where the curve meet on the vertical axis, is
R5
2R3
R10
R15
The correct Answer is:A
Number of moles in 2×10⁻⁴kg
μ=mass of hydrogen in gramMolecules mass
=2×10−4×1032
=0.1 mole
∴pV=μRT
pVT=μR=0.1×R=R10
Topper's Solved these Questions
Similar Questions
If temperature of black body increases from 300K to 900K, then the rate of energy radiation increases by
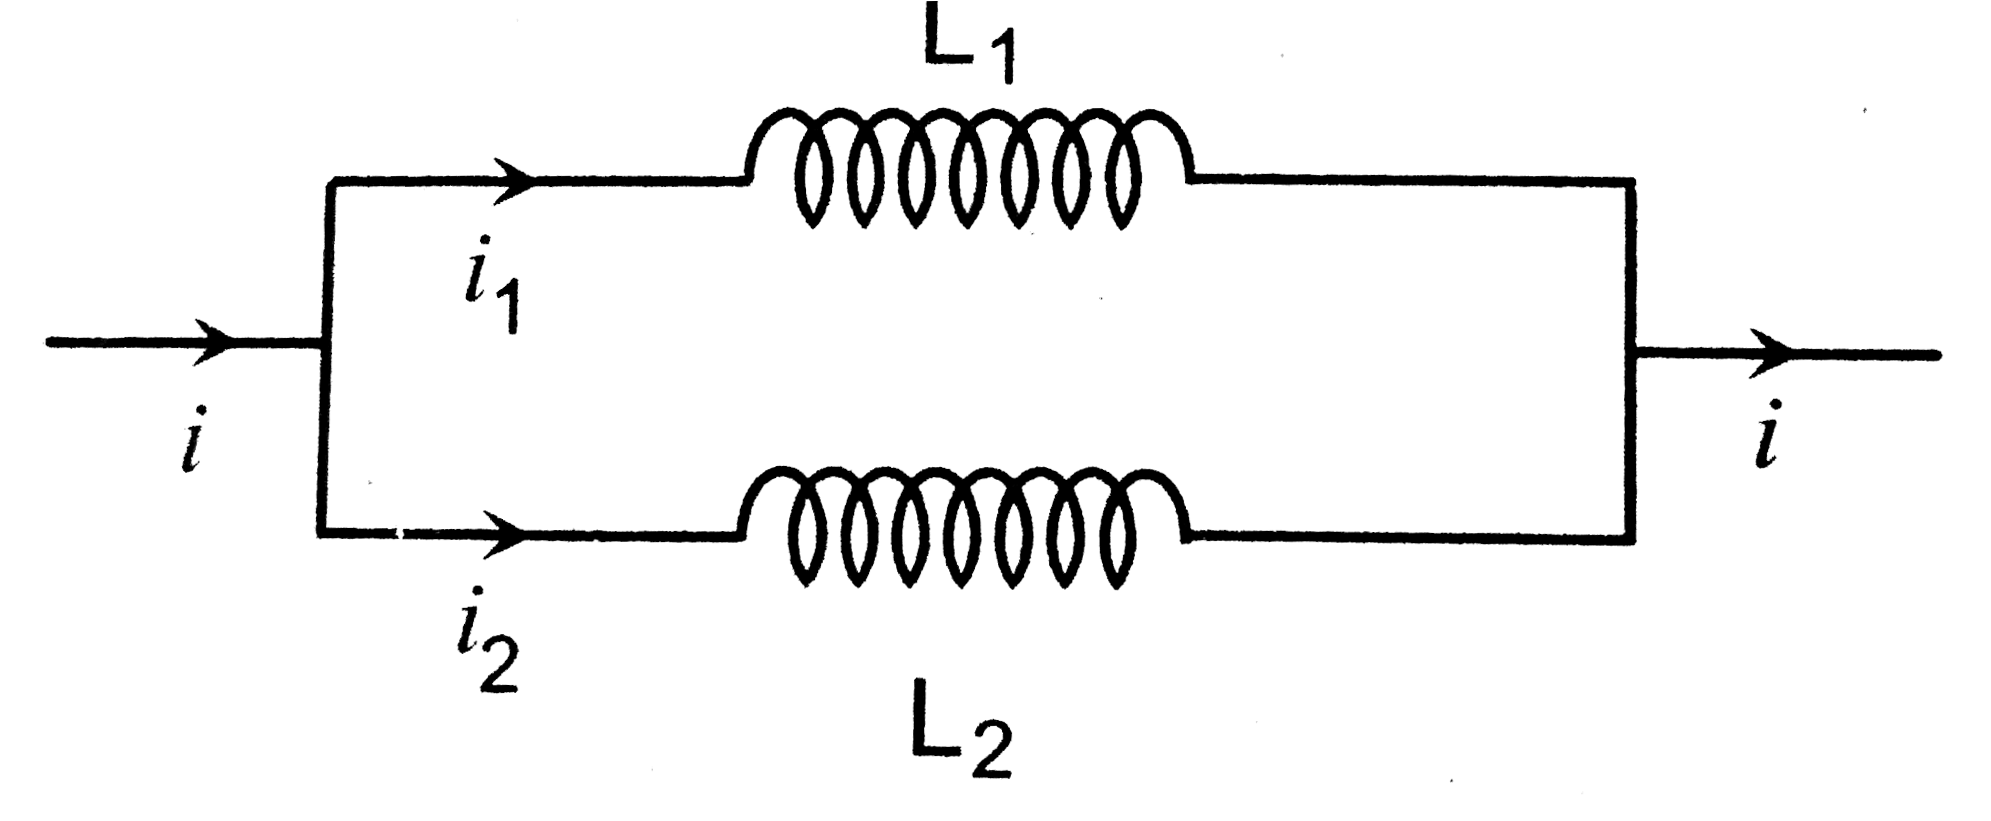
View SolutionTwo inductors L1 and L2 are connected in parallel and a time varying current flows as shown.
the ratio of current i1/i2
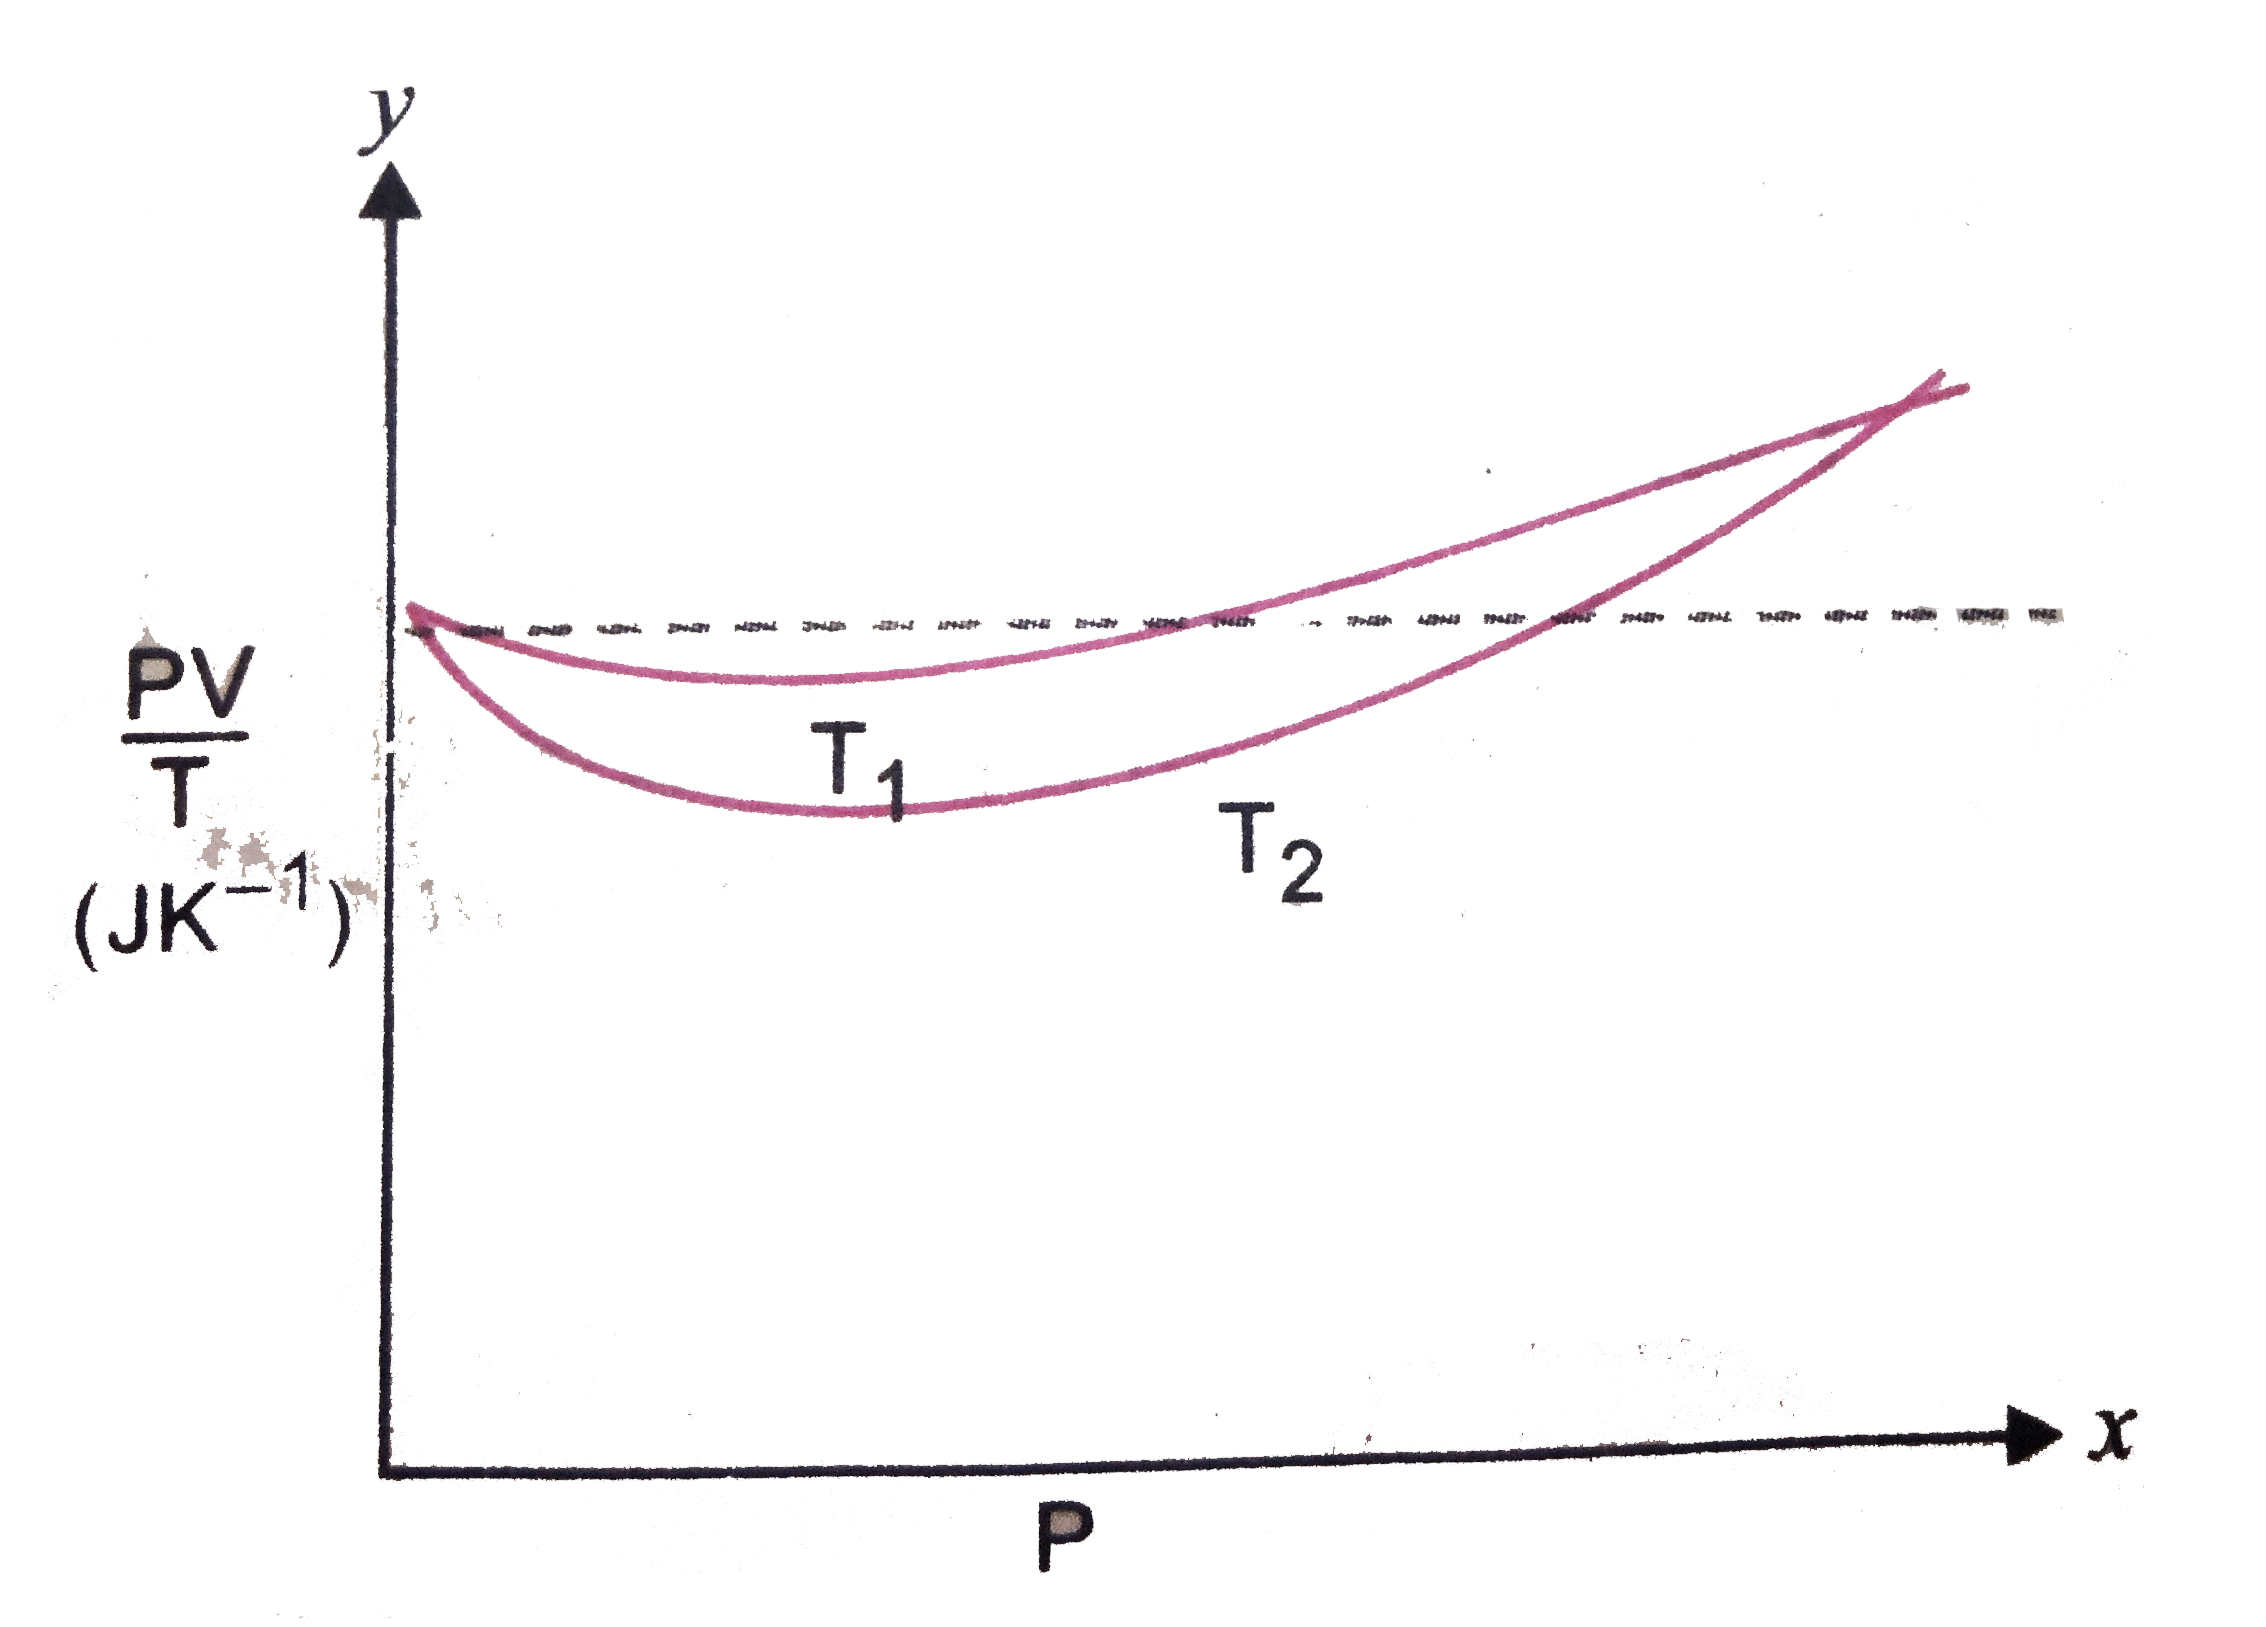
View SolutionFig shows of PV/T versus P for 1.00×10⁻³kg of oxygen gas at two different temperatures.
(a) What does the dotted plot signify ?
(b) Which is true : T1<T2orT2<T1?
( c) What is the value of PV/T where the curves meet on the Y-axis ?
(d) If we obtained similar plot for 1.00×10⁻³kg of hydrogen, would we get the same value of PV/T at the point where the curves meet on the y-axis ? If not, what mass of hydrogen yield the same value of PV/T (for low pressure high temperature region of the plot) ? (Molecular mass of H=2.02u, of O=32.0u,R=8.31Jmol−1K−1
View Solutionचित्र में ऑक्सीजन के द्रव्यमान के लिए PV/T एवं P में , दो अलग - अलग तापों पर ग्राफ दर्शाये गए है ।
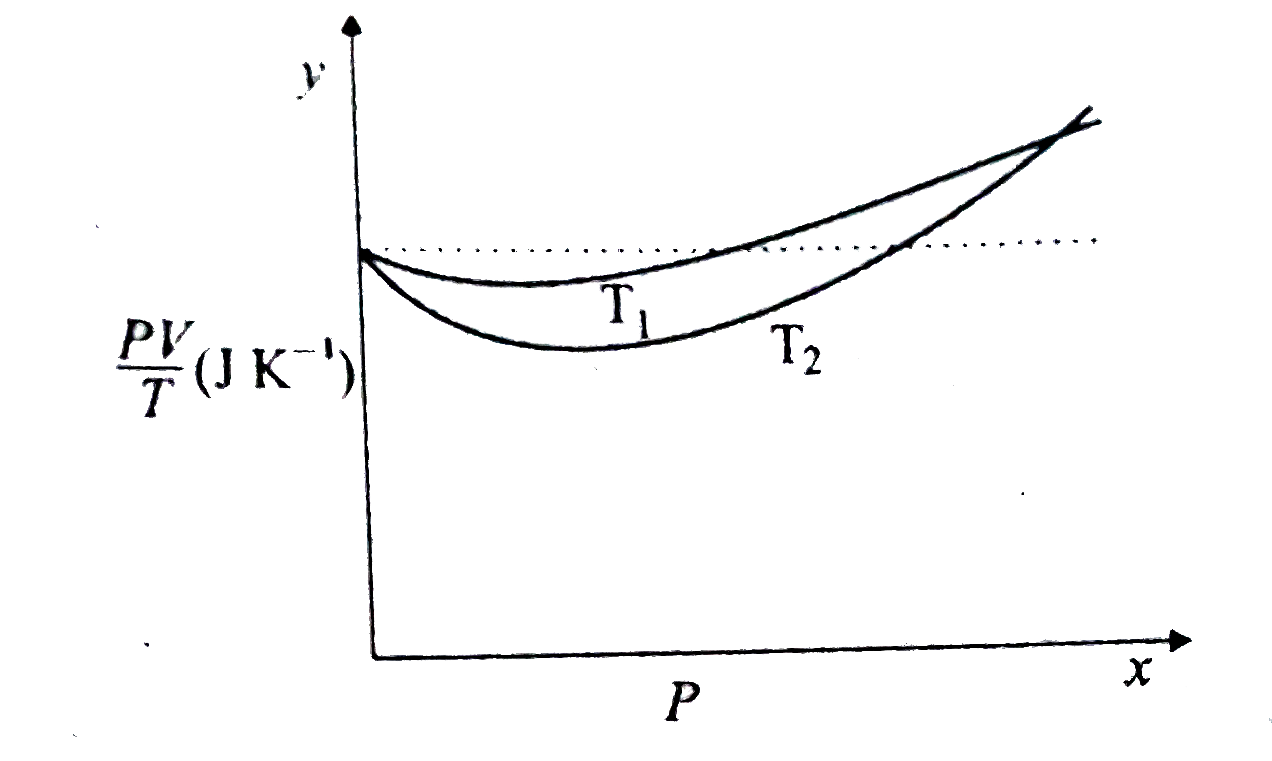
(a ) बिंदुकित रेखा क्या दर्शाती है ?
(b ) क्या सत्य है: T1>T2 अथवा T1<T2?
(c ) y - अक्ष पर जहाँ वक्र मिलते है वहाँ PV/T का मान क्या है ?
( d ) यदि हम ऐसे ही ग्राफ 1.00×10⁻³kg हाइड्रोजन के लिए बनाएँ तो भी क्या उस बिंदु पर जहाँ वक्र y - अक्ष से मिलते है PV/T का मान यही होगा ? यदि नहीं तो हाइड्रोजन के कितने द्रव्यमान के लिए PV/T का मान कम दाब और उच्च ताप के क्षेत्र के लिए वही होगा? (H2 का अणु द्रव्यमान =2.02u,O2 का अणु द्रव्यमान =32.0u,R=8.31Jmol−1K−1)
View Solutionসমান চাপ p , আয়তন V এবং তাপমাত্রা T এর দুটি গ্যাসকে মেশানো হল । মিশ্রণের আয়তন ও তাপমাত্রা যথাক্রমে V ও T হলে , চাপের মানটি হবে
View SolutionFigure Show plot of PV/T versus P for 1.00×10⁻³ kg of oxygen gas at two different temperatures.
(a) What does the dotted plot signify?
(b) Which is true: T1>T2 or T1<T2?
(c) What is the value of PV/T where the curves meet on the y-axis?
(d) If we obtained similar plots for 1.00×10⁻³ kg of hydrogen, would we get the same value of PV/T at the point where the curves meet on the y-axis? If not, what mass of hydrogen yields the same value of PV/T (for low pressure high temperature region of the plot) ? (Molecular mass of H2=2.02u,ofO2=32.0u,R=8.31Jmol−1K−1.)
View SolutionFigure Show plot of PV/T versus P for 1.00×10⁻³ kg of oxygen gas at two different temperatures.
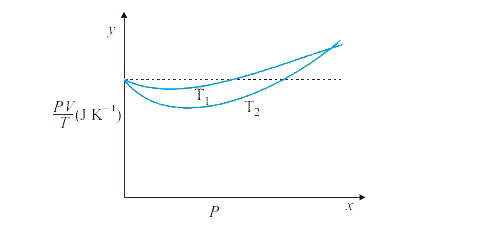
(a) What does the dotted plot signify?
(b) Which is true: T1>T2 or T1<T2?
(c) What is the value of PV/T where the curves meet on the y-axis?
(d) If we obtained similar plots for 1.00×10⁻³ kg of hydrogen, would we get the same value of PV/T at the point where the curves meet on the y-axis? If not, what mass of hydrogen yields the same value of PV/T (for low pressure high temperature region of the plot) ? (Molecular mass of H_(2) = 2.02 u, of O_(2) = 32.0 u, R= 8.31Jmol^(-1)K^(-1).)
View SolutionFigure Show plot of PV/T versus P for 1.00×10⁻³ kg of oxygen gas at two different temperatures.
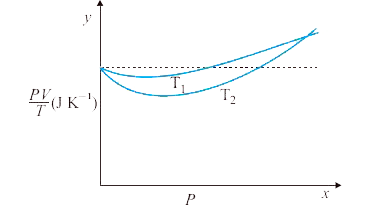
(a) What does the dotted plot signify?
(b) Which is true: T1>T2 or T1<T2?
(c) What is the value of PV/T where the curves meet on the y-axis?
(d) If we obtained similar plots for 1.00×10⁻³ kg of hydrogen, would we get the same value of PV/T at the point where the curves meet on the y-axis? If not, what mass of hydrogen yields the same value of PV/T (for low pressure high temperature region of the plot) ? (Molecular mass of H_(2) = 2.02 u, of O_(2) = 32.0 u, R= 8.31Jmol^(-1)K^(-1).)
View SolutionFigure Show plot of PV/T versus P for 1.00×10⁻³ kg of oxygen gas at two different temperatures.
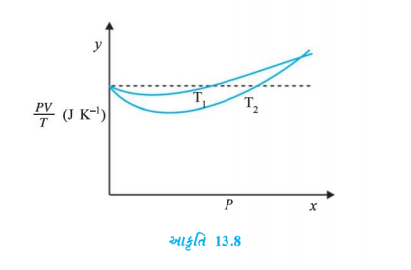
(a) What does the dotted plot signify?
(b) Which is true: T1>T2 or T1<T2?
(c) What is the value of PV/T where the curves meet on the y-axis?
(d) If we obtained similar plots for 1.00×10⁻³ kg of hydrogen, would we get the same value of PV/T at the point where the curves meet on the y-axis? If not, what mass of hydrogen yields the same value of PV/T (for low pressure high temperature region of the plot) ? (Molecular mass of H_(2) = 2.02 u, of O_(2) = 32.0 u, R= 8.31Jmol^(-1)K^(-1).)
View SolutionFigure show plot of (PV)/(T) and P for 2gm of oxygen gas at two different temeratures. (i)The significance of dotted line (ii)The relation between T_(1) and T_(2) (iii)The value of (PV)/(T) where the curves meet on the Y-axis.
View SolutionFigure shows plot of PVT and P for 2gm of oxygen gas at two different temperatures
(i) The significance of dotted line
(ii) The relation between T1andT2
(iii) The value of PVT where the curves meet on the x-axis.
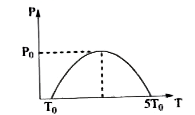
View SolutionFigure shows the graph of pressure (P) versus temperature (T) (which is parabola) for a gas corresponding to a certain process. The equation of the curve is
View SolutionA gas is governed by an equation V=(aT^(3))/(P) where P,V and T are pressure, volume and temperature of the gas respectively and .a. is a constant. If the temperature of the gas is doubled at constant pressure then the workdone by the gas is
View SolutionFigure 13.8 shows plot of PV/T versus P for l.OO×lO−3 kg of oxygen gas at two different temperatures. What does the dotted plot signif?:
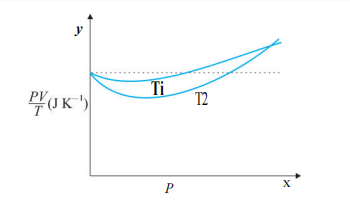
View SolutionFigure 13.8 shows plot of PV//T versus P for l.OOxxlO^-3 kg of oxygen gas at two different temperatures.Which is true: T_1 > T_2 or T_1
View SolutionFigure 13.8 shows plot of PV//T versus P for l.OOxxlO^-3 kg of oxygen gas at two different temperatures What is the value of PV/Twhere the curves meet on the y-axis? :
View Solution
