Study the following information carefully and answer the given questions.
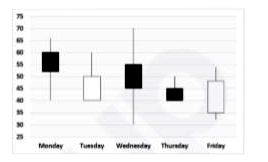
The following chart shows the opening, closing, high and low price of a share of a company XYZ on given 5 days-Monday, Tuesday, Wednesday, Thursday and Friday.
Opening and closing price of the shares of the company XYZ are represented by ceiling and floor of the black box and floor and ceiling of the white box respectively. The high and low price of the share of the company XYZ are represented by ceiling and floor of the line respectively
For example: On Monday, opening price = 60, closing price = 52, high price = 66 and low price = 40
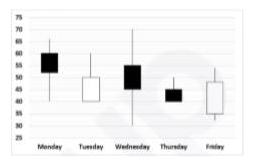
A trader, bought 150 shares of the company XYZ on opening price of Tuesday and sold 40% these shares on highest price of the share on Thursday and rest on opening price of Friday. Rate of commission while buying the shares is Flat Rs. 200 and while selling it is 8% of the selling price, then what is the total loss incurred by the trader in this transaction?
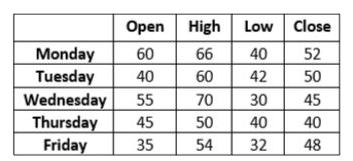
Total cost price of shares =150×40= Rs . 6000
Total cost price of shares
Total selling price =40%of150×50+60%of150×35=3000+3150 = Rs 6150 Total commission while selling =8% oif 6150 = Rs. 492
Hence, the total loss incurred by trader = 6000 + 200 + 492 - 6150 = Rs . 542
Similar Questions
Study the following information carefully and answer the given questions.
The following chart shows the opening, closing, high and low price of a share of a company XYZ on given 5 days-Monday, Tuesday, Wednesday, Thursday and Friday.
Opening and closing price of the shares of the company XYZ are represented by ceiling and floor of the black box and floor and ceiling of the white box respectively. The high and low price of the share of the company XYZ are represented by ceiling and floor of the line respectively
For example: On Monday, opening price = 60, closing price = 52, high price = 66 and low price = 40
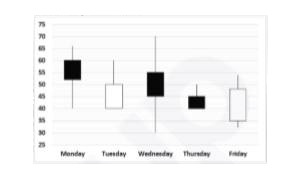
Average closing price of shares of the company XYZ is what percent more than the average opening price for the given 5 days?
View SolutionStudy the following information carefully and answer the given questions.
The following chart shows the opening, closing, high and low price of a share of a company XYZ on given 5 days-Monday, Tuesday, Wednesday, Thursday and Friday.
Opening and closing price of the shares of the company XYZ are represented by ceiling and floor of the black box and floor and ceiling of the white box respectively. The high and low price of the share of the company XYZ are represented by ceiling and floor of the line respectively
For example: On Monday, opening price = 60, closing price = 52, high price = 66 and low price = 40
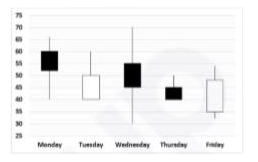
What is the ratio of average high price and average low price of the share of the company XYZ on Monday, Tuesday, Wednesday and Friday?
View Solution
Knowledge Check
Study the following graph carefully and answer the questions -----
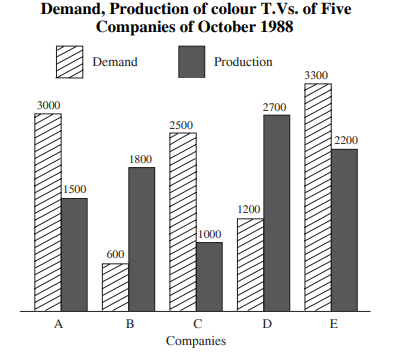
The production of company D is approximately how many times that of the production of the company A ?A1.8B1.5C2.5D1.11Study the following graph carefully and answer the questions -----
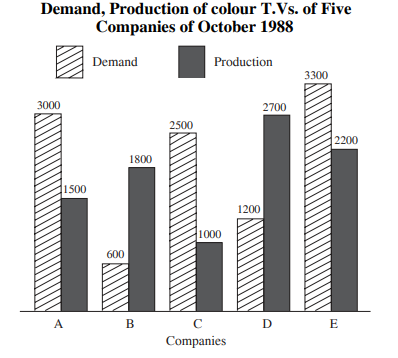
The demand for company 'B' is approximately what percent of the demand for company 'C' ?A4B24C20D60Study the following graph carefully to answer these questions-
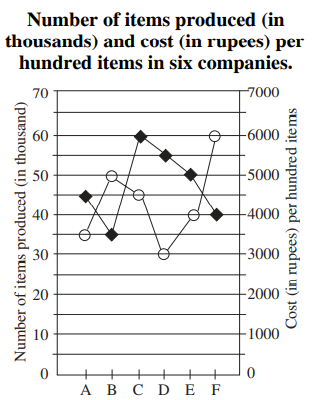
What is the average cost per hundred items for all the given companies?ARs. 4183 23BRs. 4184 13CRs. 433 23DNone of these
Study the following information carefully and answer the given questions.
The following chart shows the opening, closing, high and low price of a share of a company XYZ on given 5 days-Monday, Tuesday, Wednesday, Thursday and Friday.
Opening and closing price of the shares of the company XYZ are represented by ceiling and floor of the black box and floor and ceiling of the white box respectively. The high and low price of the share of the company XYZ are represented by ceiling and floor of the line respectively
For example: On Monday, opening price = 60, closing price = 52, high price = 66 and low price = 40
A trader, bought X shares of the company XYZ on Wednesday and sold 20% of the shares on Wednesday itself. If he sold 4/9th of the remaining shares on closing price of the Thursday and the remaining shares on opening price of Friday. If rate on commission while selling the shares is Rs. 100 for sales amount upto Rs. 3000 and 10% above that amount. If on Friday he gets Rs. 5240 for selling shares after deduction of commission, then the value of x is
View SolutionStudy the following information carefully and answer the given questions: The following bar graph shows the price per square feet of lands in different years
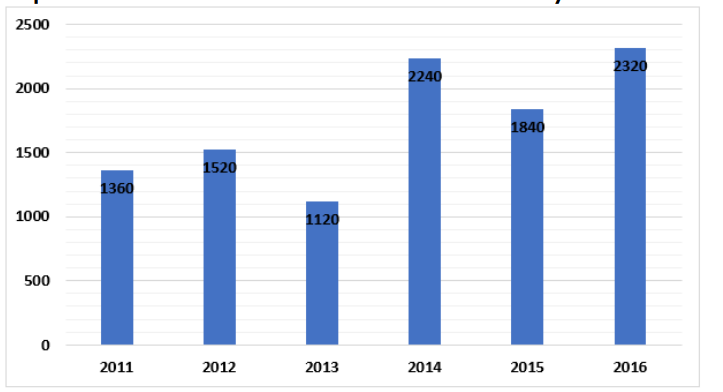
The price per square feet in the year 2011 and 2014 together is approximately what percentage of the price per square feet in the year 2012 and 2015 together?
View SolutionStudy the following graph carefully and answer the given questions :-
The following graph shows the % profit of two companies over the years :-
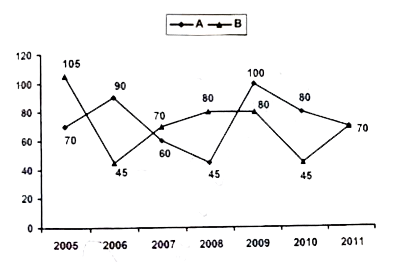
If the total expenditure of company A in 2007 was Rs 150 lakhs what was the total income ?
View SolutionStudy the following graph carefully and answer the given questions :-
The following graph shows the % profit of two companies over the years :-
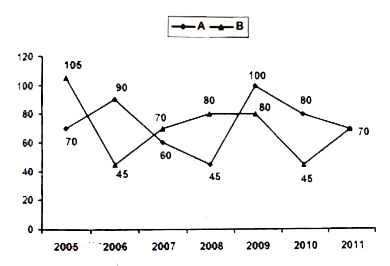
In which of the following years the ratio of expenditure to income was the least for company B?
View SolutionStudy the following graph carefully to answer the questions given below.
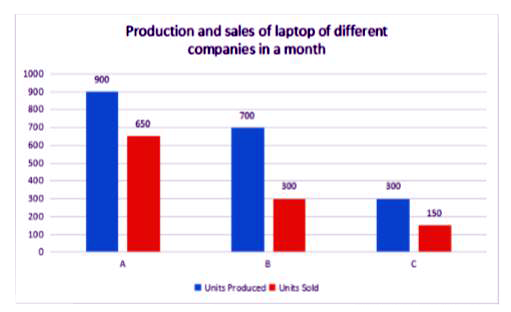
What is the average number of Units produced by all the Companies together?
View Solution
