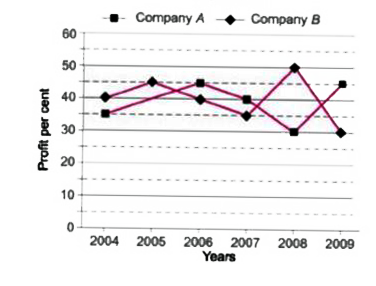
Study the following graph carefully and answer the given questions :-
The following graph shows the % profit of two companies over the years :-
If the total expenditure of company A in 2007 was Rs 150 lakhs what was the total income ?
A) Rs 240 lakhs
B) Rs 250 lakhs
C) Rs 260 lakhs
D) Data inadequate
The correct Answer is:A
Step by step video & text solution for Study the following graph carefully and answer the given questions :- The following graph shows the % profit of two companies over the years :- If the total expenditure of company A in 2007 was Rs 150 lakhs what was the total income ? by Maths experts to help you in doubts & scoring excellent marks in Class 14 exams.
Updated on:21/07/2023Topper's Solved these Questions
Similar Questions
Study the following graph carefully and answer the question given below-
Amount of Rice, Wheat and Sugar Consumed by various restaurants over a years.
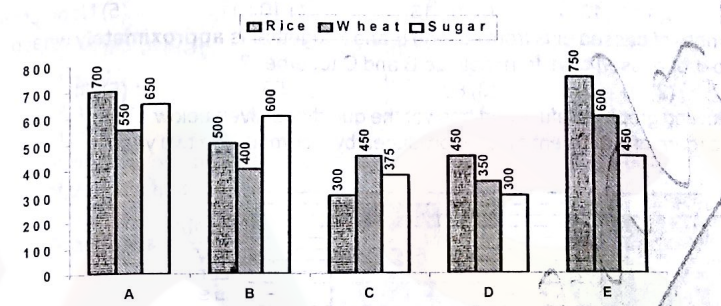
What is the respective ratio of the amount of Rice, Wheat and Sugar consumed by restaurant D to the same consumed by restaurant B ?
View SolutionIn one hour,a boat goes 11 km along the stream and 5 km against the stream. Then speed of the boat in still water (in km/hr) is :
View SolutionThe total of the present ages of A,B,C and D is 96 years. What is B's present age ?
(i) The average age of A, B and D is 20 years.
(ii) The average age of C and D is 25 years.
View Solutionग्राफ में किसी कम्पनी के मासिक व्यय को दर्शाया गया है। ग्राफ का अध्ययन कीजिए और निम्नलित प्रश्नों के उत्तर दीजिए ?
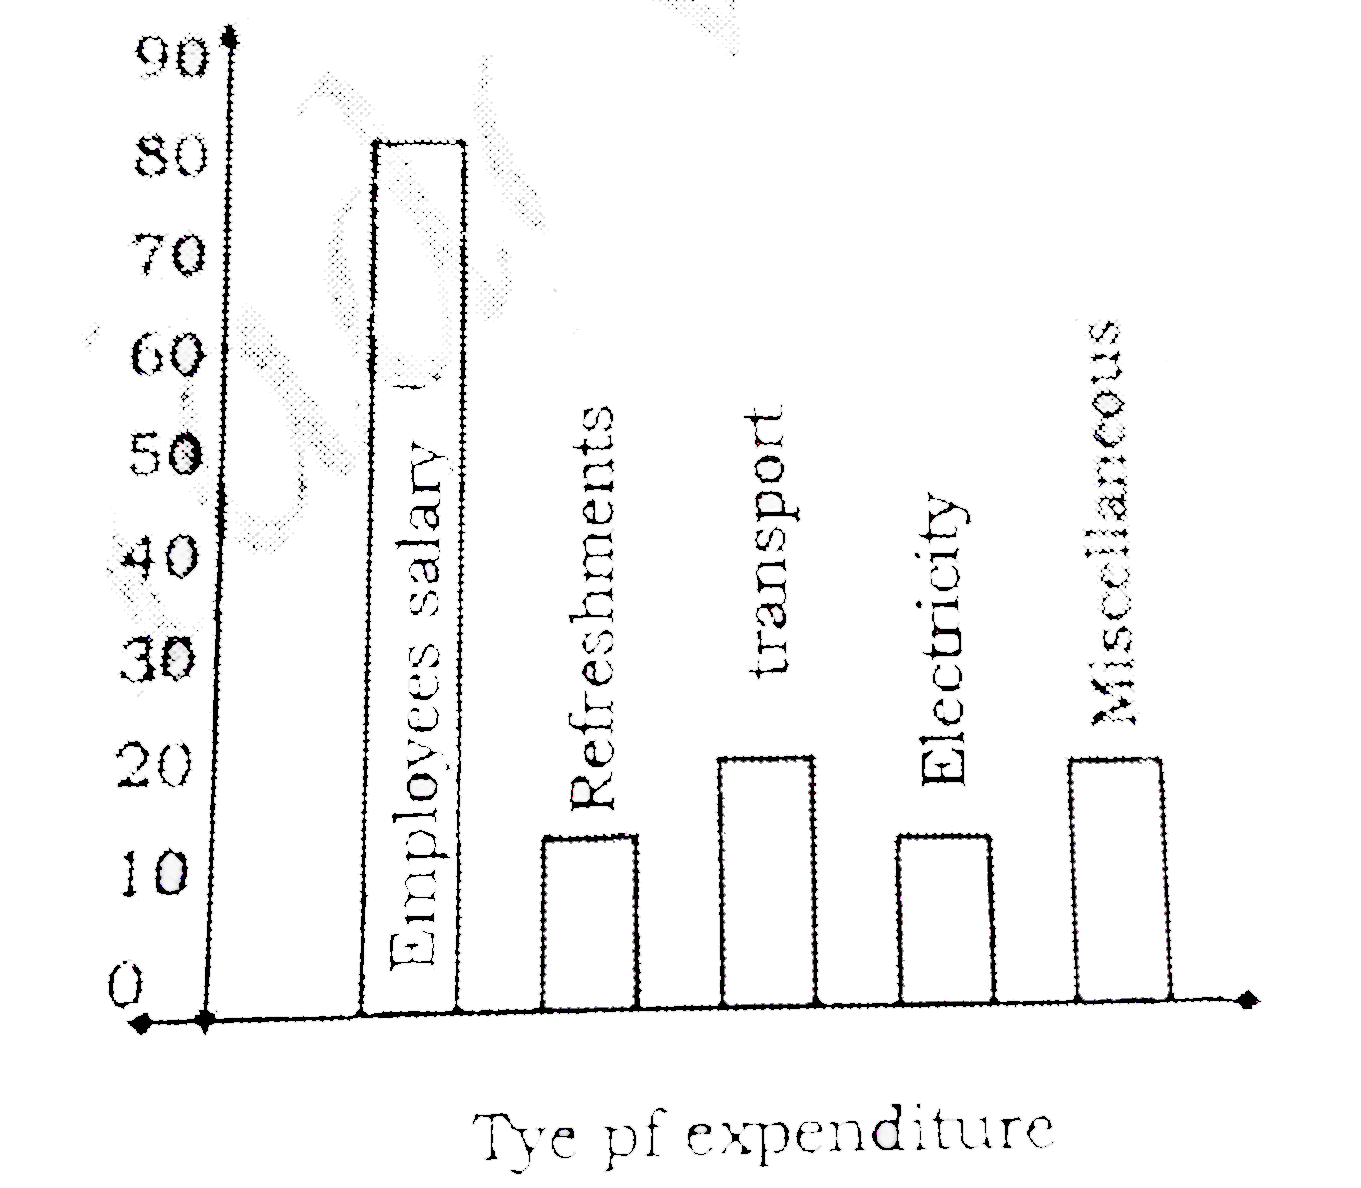
कम्पनी का कुल मासिक व्यय कितना है ?
View SolutionMatch the following Column A to Column B

View SolutionThe inequation represented by the graph given below is :
View SolutionThe inequation that best describes the graph given below is _________
View SolutionThe inequation that best describes the following graph is _________
View SolutionStudy the following graph carefully and answer the questions that follow
If the amount of profit earned by company A in the year 2007 was ? 1.5 lakh , what was its expenditure in that year ?
View SolutionStudy the following graph carefully to answer the questions given below. Expenditure in lakhs) of three different Companies in Five Different Years Total expenditure of all the three companies together in the year 2006 was what Percentage of the total expenditure of Company A over all the years together?
View SolutionStudy the following graph carefully to answer the questions that follows
In the given years total earned profit by two companies
% profit=Income-ExpenditureExpenditure×100%
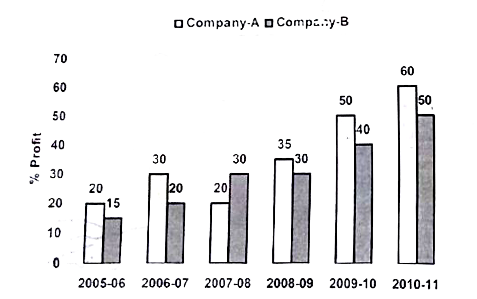
If income of company B in 2009-10 was 175 crore then what was the expenditure of company B in 2010-11?
View SolutionStudy the following graph carefully to answer the questions that follows
In the given years total earned profit by two companies
% profit=Income-ExpenditureExpenditure×100%
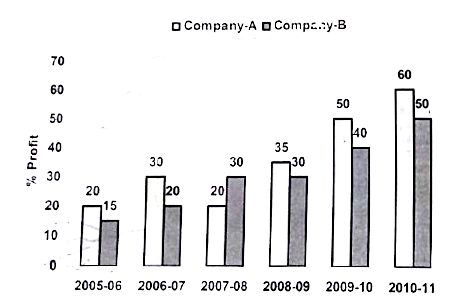
In 2010-11 the income of company B was 144 crore. What was the expenditure in that year?
View SolutionStudy the following graph carefully to answer the questions that follows
In the given years total earned profit by two companies
% profit=Income-ExpenditureExpenditure×100%
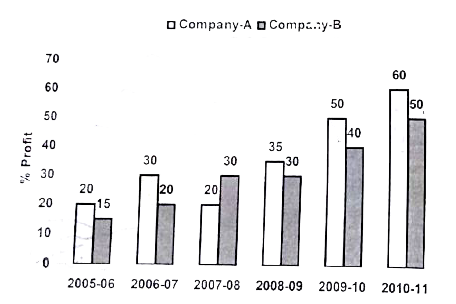
What was the difference between the expenditure of two companies in 2007-08 ?
View SolutionStudy the following graph carefully to answer the questions that follows
In the given years total earned profit by two companies
% profit=Income-ExpenditureExpenditure×100%
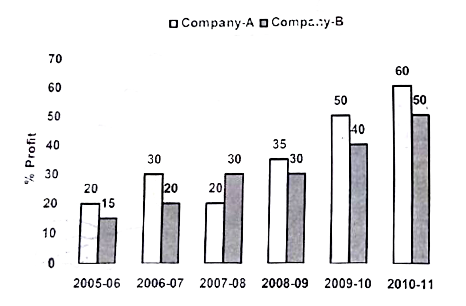
In 2005-06 the expenditure of company A was 40 crore. What was income in that year?
View SolutionThe following graph given the annual percent profit earned by a company during the period 1996-2001. Study the graph carefully and answer the questions that follow. Profit=Income - Expenditure The expenditure of the company during the year 1996 was Rs 30 Lakhs. The income of the company in that year was (in Lakhs Rs):
View SolutionIn the given bar graph , the white bar shows the income and the black bar shows the expenditure of company (in Rs. Lakhs) . Study the graph and answer the question that follows . The percentage decrease in the income of the company in 2002 as compared to that in 2001 is :
View Solution
