a block of ice at temperature −20∘C is slowly heated and converted to steam at 100∘C which of the following diagram is most appropriate
A
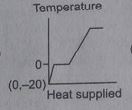
B
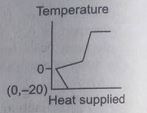
C
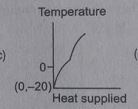
D
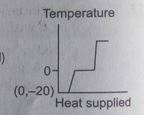
Text Solution
The correct Answer is:A
|
Similar Questions
Knowledge Check
A block of ice at −12∘C is slowly heated and converted into steam at 100∘C. Which of the following curves best represents the event ?
A B
B C
C D
D
A block of ice at −10∘C is slowly heated and converted to steam at 100∘C. Which of the following curves represents the phenomenon qualitatively?
A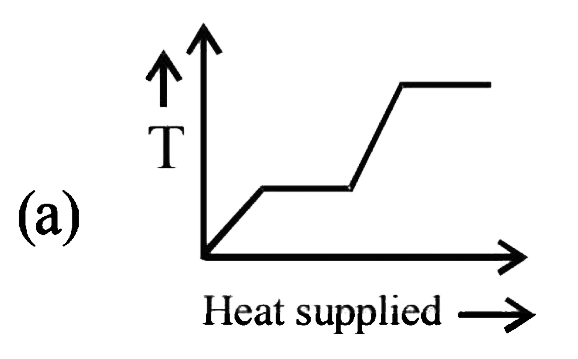 B
B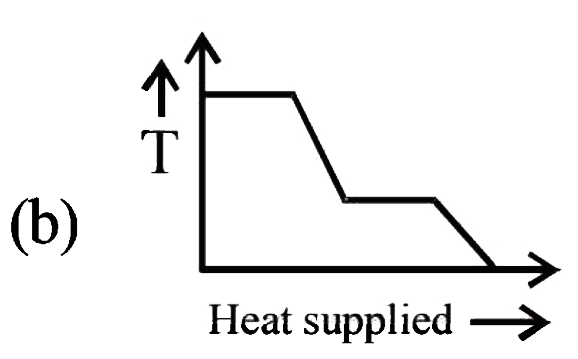 C
C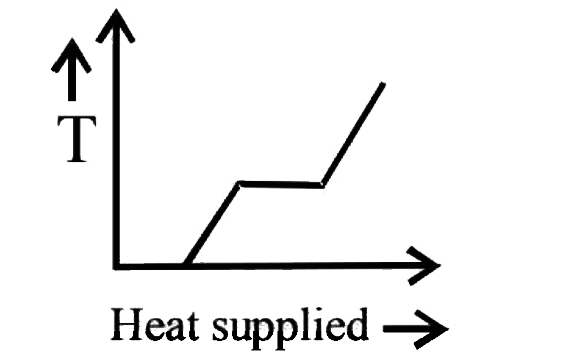 D\
D\A block of ice at −10∘C is slowly heated and converted to steam at 100∘C. Which of the following curves represents the phenomenon qualitatively?
A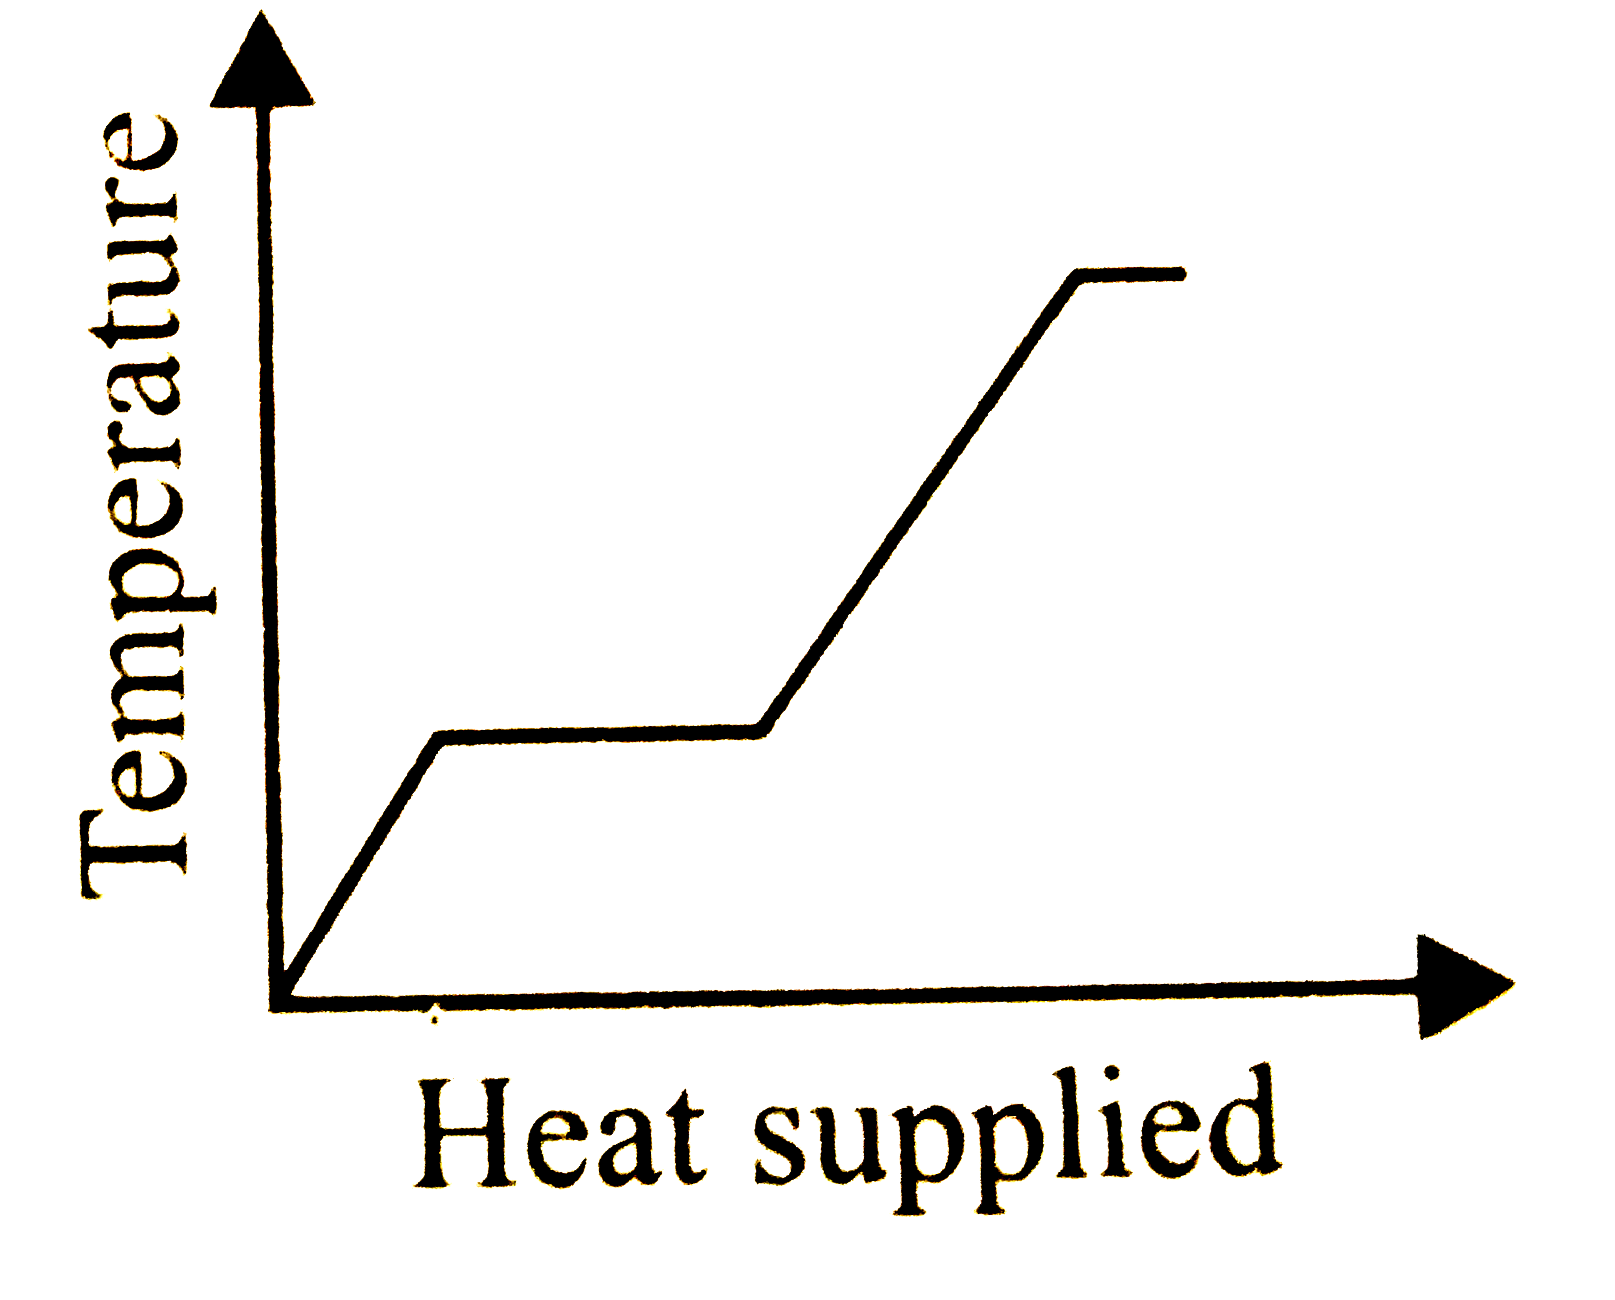 B
B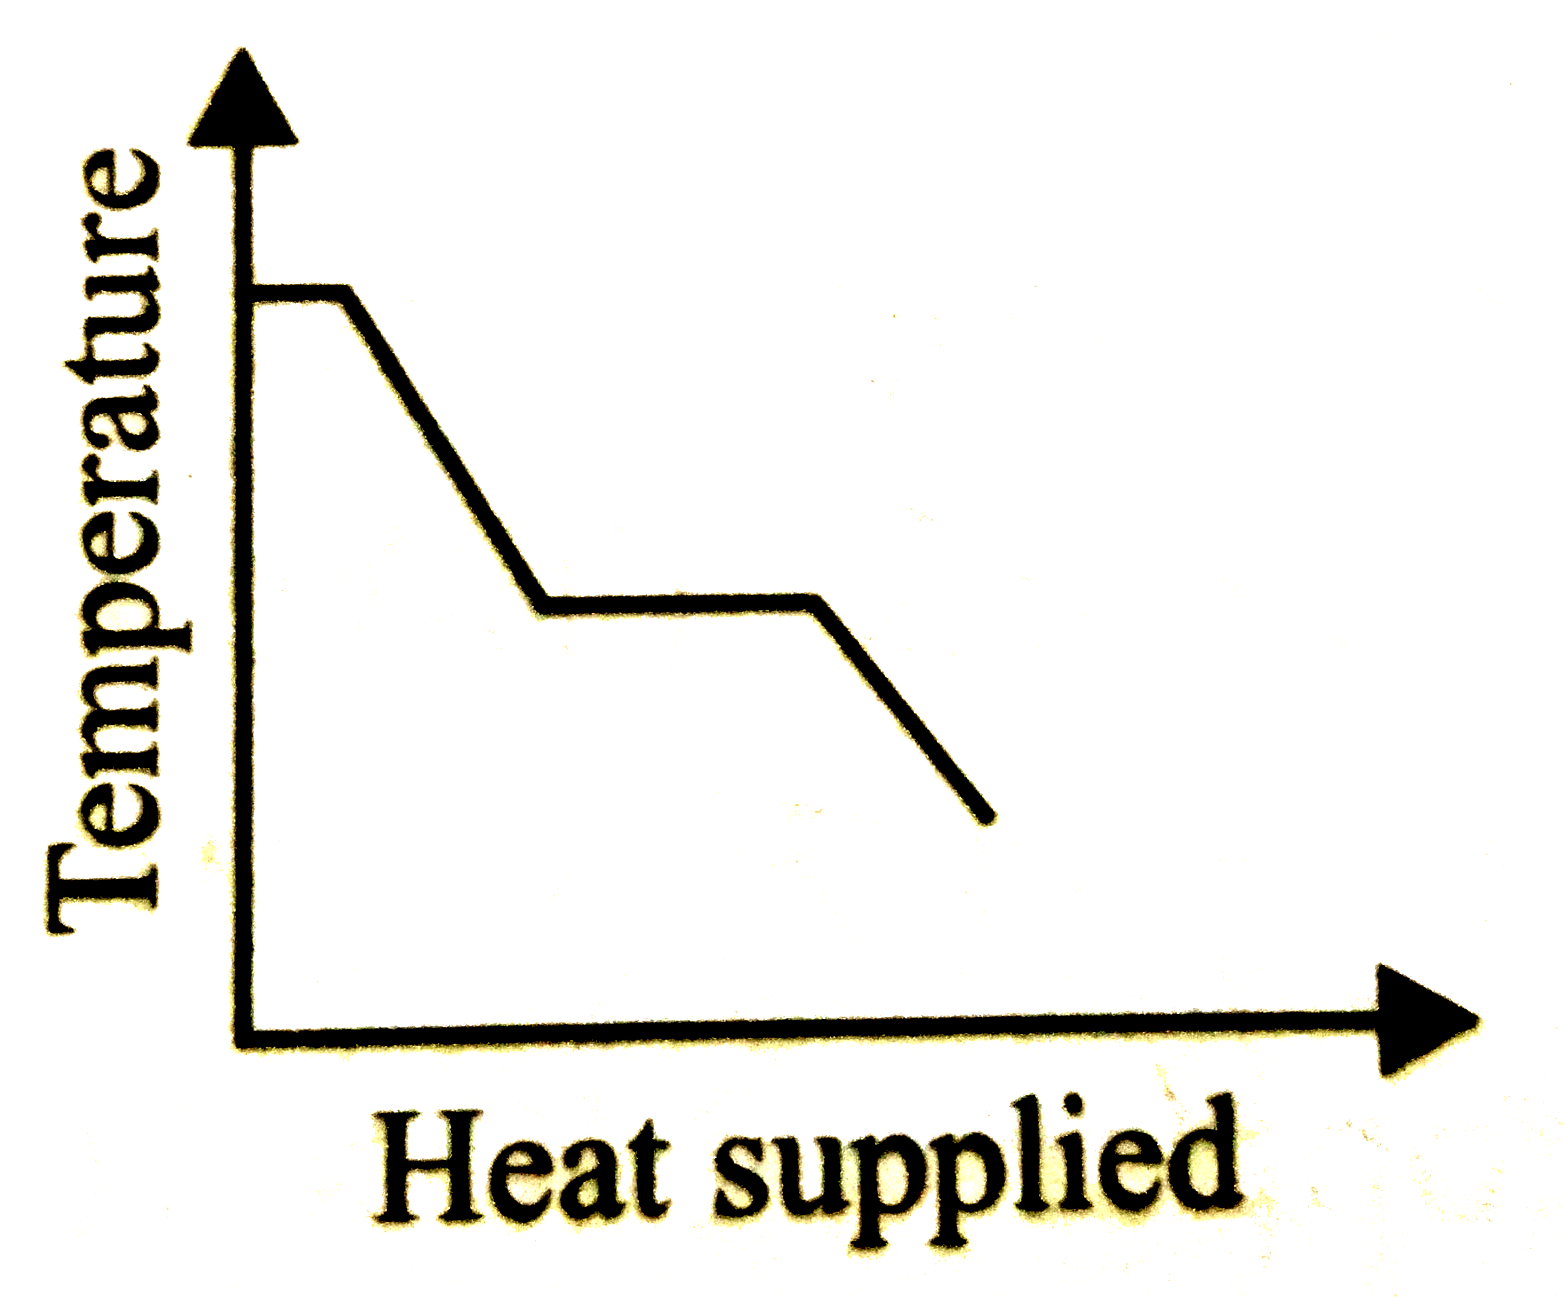 C
C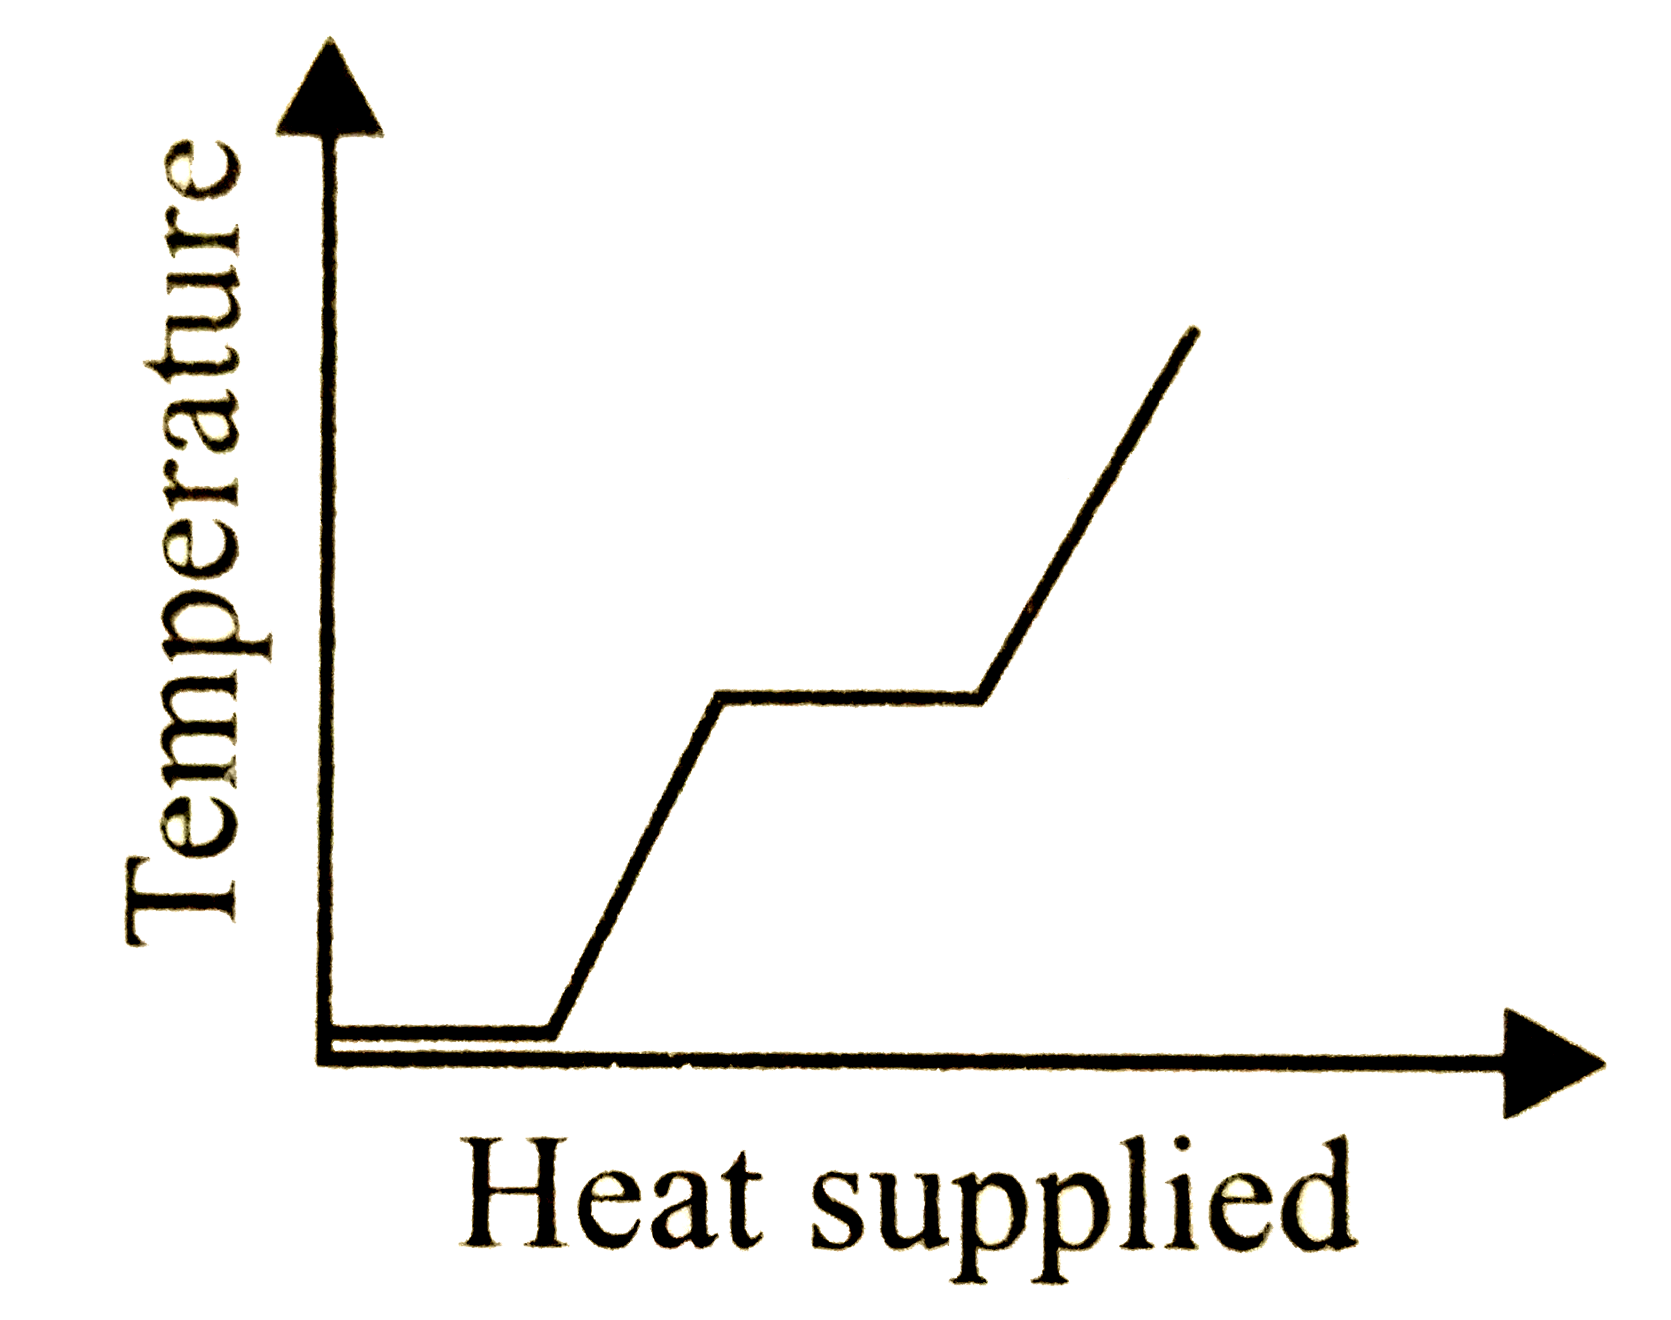 D
D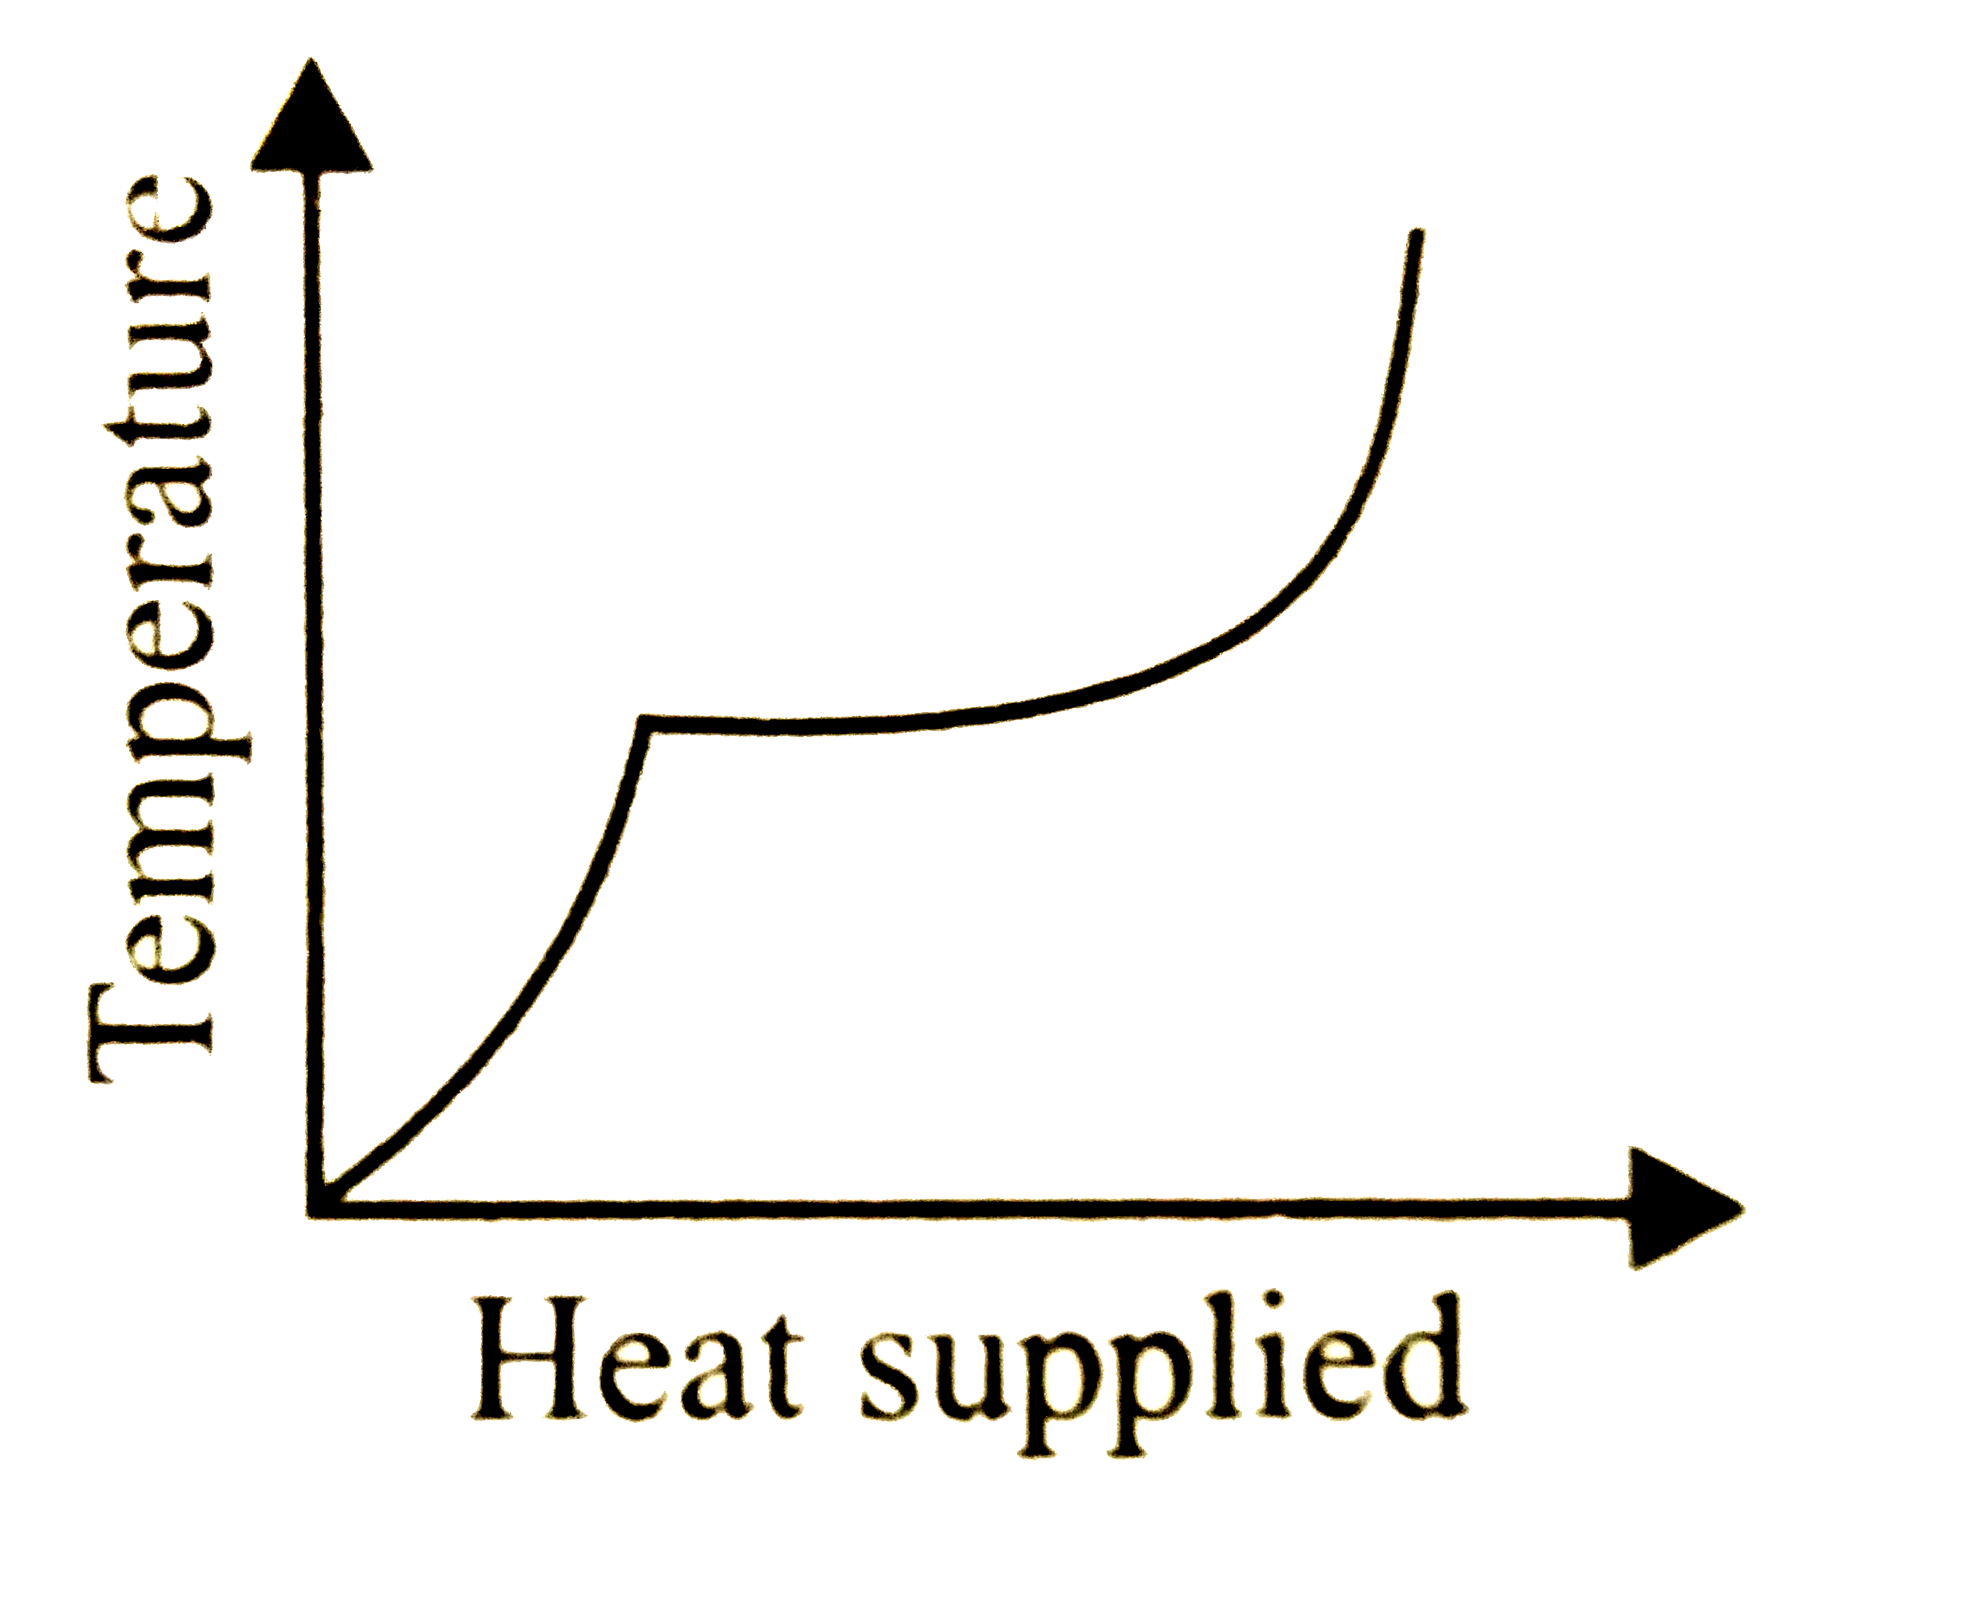
Ice at 0∘C is converted into steam at 100∘C. State the isothermal changes in this process?
View SolutionA block of ice −10∘C is slowly heated and converted to steam at 100∘C. Which of the following curves represent the phenomenon qualitatively?
View SolutionA block of ice at −5∘C is slowly heated and converted to steam at 100∘C . The process can be qualitatively represented by the curve
View SolutionA block of ice at 0∘C is converted to steam at 100∘C. Which process will require the most amount of heat?
View SolutionA block of ice, initially at −20∘C, is heated a steady rate until the temperature of the sample reaches 120∘C. Which of the following graphs best illustrates the temperature of the sample as a function of time?
View Solution

