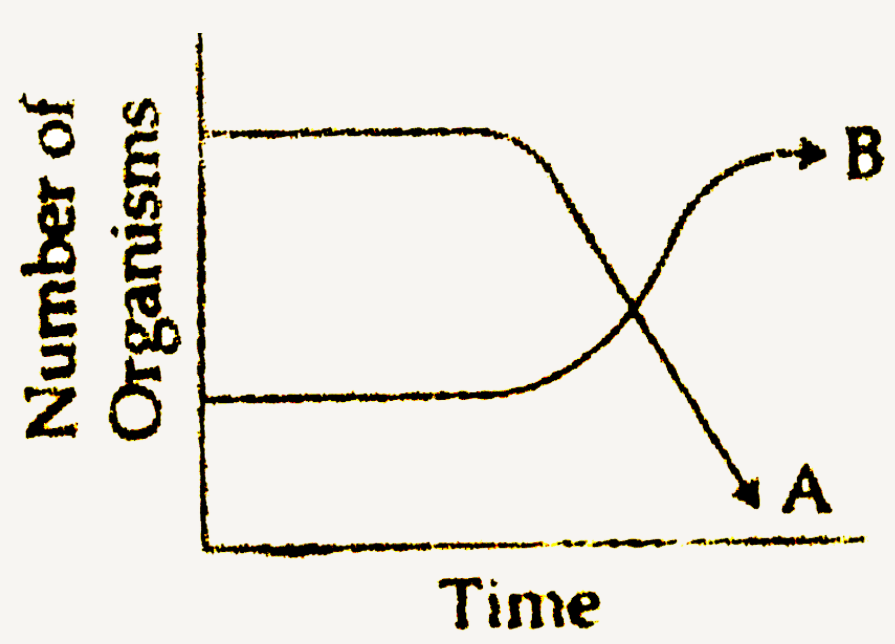
The following graph depicts changes in two populations (A and B) of herbivores in a grassy field A possible reason for these changes is that
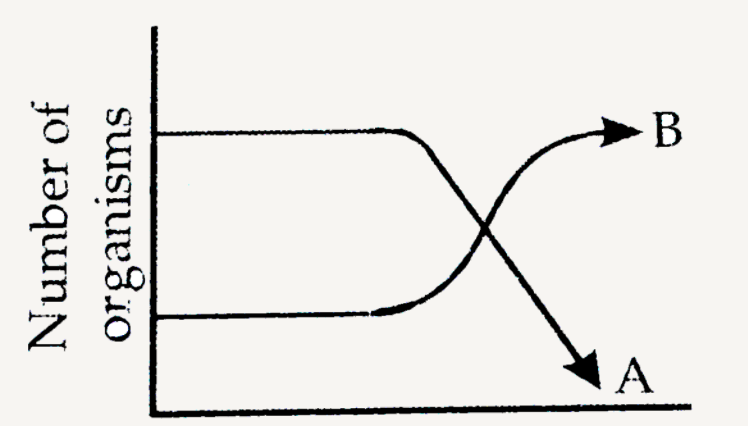
Population A produced more offspring than population B
Population A consumed the members of population B
Both plant populations in this habitat decreases
Population B competed more successfully for food than population A
The correct Answer is:D
Step by step video solution for The following graph depicts changes in two populations (A and B) of herbivores in a grassy field A possible reason for these changes is that by Biology experts to help you in doubts & scoring excellent marks in Class 12 exams.
Updated on:21/07/2023Topper's Solved these Questions
- ORGANISMS AND POPULATIONSBOOK - AAKASH SERIESCHAPTER - ORGANISMS AND POPULATIONSEXERCISE - EXERCISE-II (POPULATION INTERACTIONS)
1 Video
- NEURAL CONTROL AND COORDINATIONBOOK - AAKASH SERIESCHAPTER - NEURAL CONTROL AND COORDINATIONEXERCISE - EXERCISE-III( PREVIOUS AIPMT / NEET QUESTIONS)
33 Videos
- PHOTOSYNTHESIS IN HIGHER PLANTS BOOK - AAKASH SERIESCHAPTER - PHOTOSYNTHESIS IN HIGHER PLANTS EXERCISE - Exercise - III
27 Videos
Similar Questions
If a organism's body pattern resembles its environment making it difficult to spot, it is called as
View SolutionReceptor sites for neurotransmitters are present on
View SolutionPhosphoenol pyruvate (PEP) is the primary CO2 acceptor in
View SolutionThe following graph depicts changes in two populations (A and B) of herbivores in a grassy field. A possible reason for these changes is that :
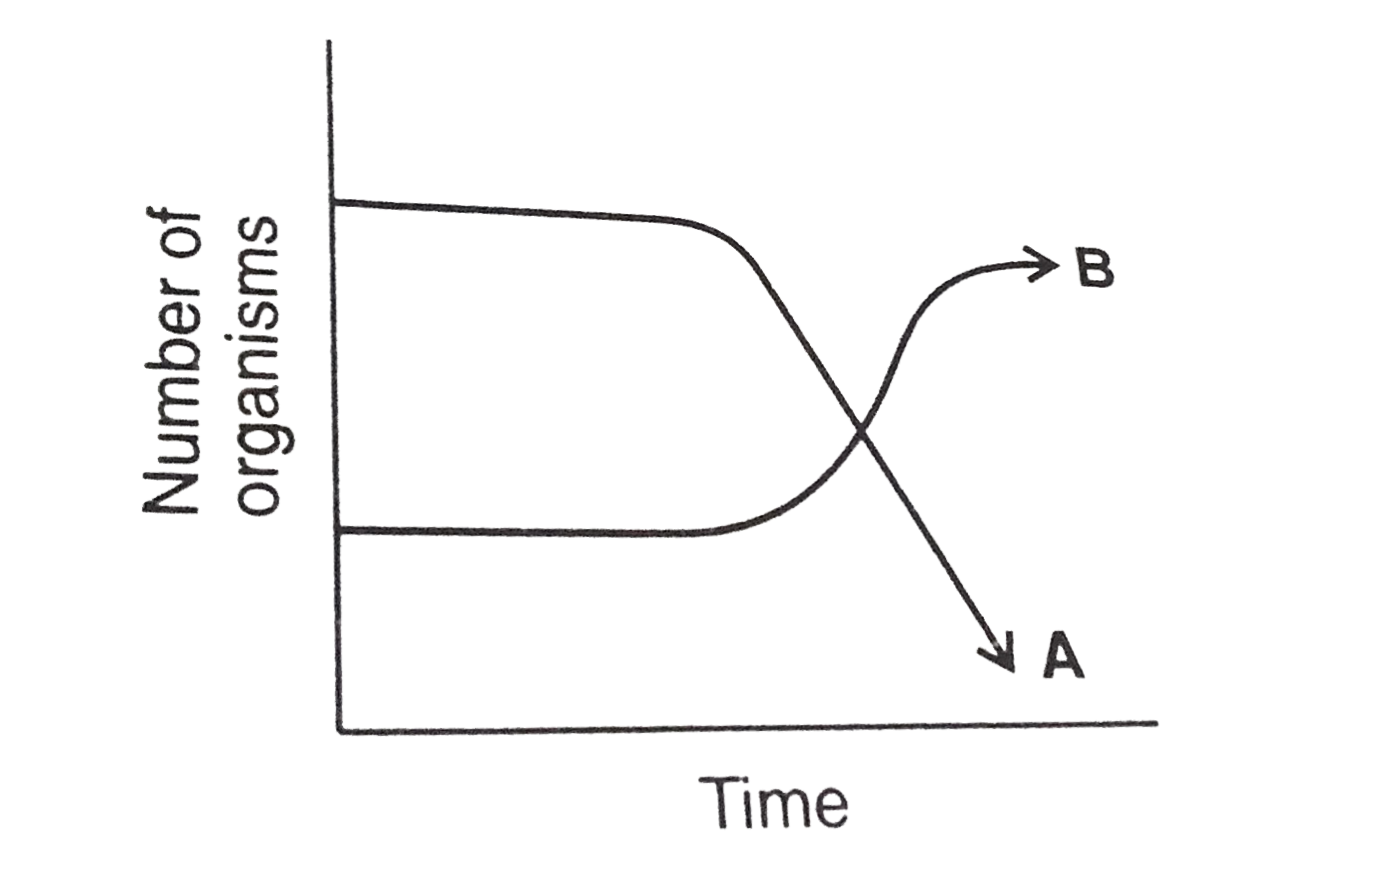
View SolutionThe graph below shows the changes in two populations of herbivores in a grassy field. A possible reason for these changes is that

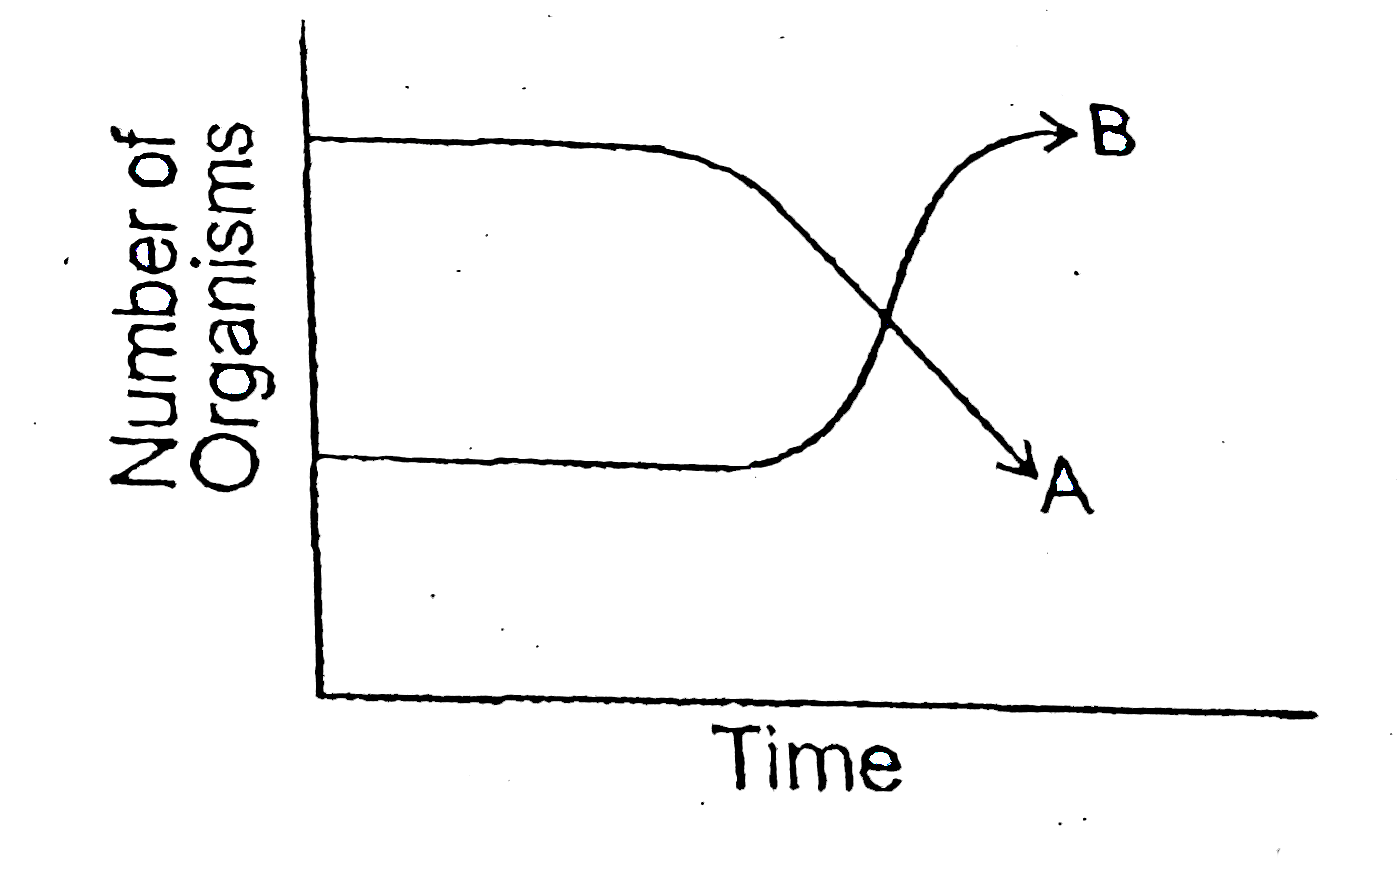
View SolutionThe following graph depicts changes in two populations (A and B) of herbivores in a grassy field. A possible reason for these changes is that
View SolutionWhich of the following graphs best depicts the changes in one cycle of PCR ?
View Solutionनिम्नलिखित ग्राफ एक घासीय मैदान में शाकाहारियों समष्टियों ( और ) में होने वाले परिवर्तनों को बताता है परिवर्तनों का सम्भावी कारण है कि
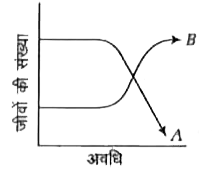
View Solutionनिम्नलिखत ग्राफ एक घासीय मैदान में शाकाहारयों की दो | समष्टियों (A और B) में होने वाले परिवर्तनों को बताता हैं। इन परिवर्तनों का संभावी कारण है कि :
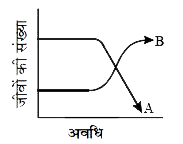
View SolutionThe following graph depicts changes in two populations (A and B) of herbivores in a grassy field. A possible reson for these changes is that
View SolutionThe following graph depicts changes in two populations (A and B) of herbivores in a grassy field A possible reason for these changes is that

View SolutionThe following graph depicts changes in two populations A and B of herbivores in a grassy field. A possible reason for these changes is that
View SolutionThe following graph depicts changes in two populations (A and B) of herbivores in a grassy field. A possible reason for these changes is that

View SolutionThe following graph depicts changes in two populations (A and B) of herbivores in a grassy field. A possible reason for these changes is that

View SolutionThe following graph depicts changes in two populations (A and B) of herbivores in a grassy field. A possible reson for these changes is that

View SolutionThe following graph depicts changes in two populations (A and B) of herbivores in a grassy field A possible reason for these changes is that

View Solution

