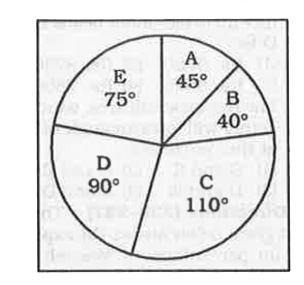
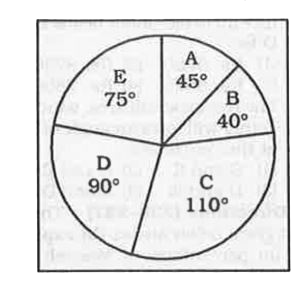
If the number of cars sold of model D is 72900, then what is the total number of cars sold of all the models together by the company?
291600
208100
162000
214160
The correct Answer is:A
To find the total number of cars sold of all models together by the company, we can follow these steps:
Step 1: Understand the Pie Chart Distribution
The pie chart represents the distribution of cars sold for different models (A, B, C, D, and E) in degrees. Each model corresponds to a certain number of degrees, which reflects the proportion of total sales.
Step 2: Identify the Degrees for Model D
From the video transcript, we know that Model D corresponds to 90 degrees in the pie chart.
Step 3: Relate Degrees to Actual Sales
We are given that the number of cars sold for Model D is 72,900. This means that 90 degrees corresponds to 72,900 cars.
Step 4: Calculate the Value of One Degree
To find the total number of cars sold, we first need to determine how many cars correspond to one degree. We can do this by dividing the number of cars sold for Model D by the degrees it represents:
Value of one degree=Cars sold for Model DDegrees for Model D=72,90090
Calculating this gives:
Value of one degree=810 cars
Step 5: Calculate Total Degrees in the Pie Chart
The total degrees in a pie chart is always 360 degrees.
Step 6: Calculate Total Number of Cars Sold
Now, we can find the total number of cars sold by multiplying the value of one degree by the total degrees in the pie chart:
Total Cars Sold=Value of one degree×Total degrees=810×360
Calculating this gives:
Total Cars Sold=291,600 cars
Final Answer
The total number of cars sold of all models together by the company is 291,600 cars.
---
The pie chart represents the distribution of cars sold for different models (A, B, C, D, and E) in degrees. Each model corresponds to a certain number of degrees, which reflects the proportion of total sales.
From the video transcript, we know that Model D corresponds to 90 degrees in the pie chart.
We are given that the number of cars sold for Model D is 72,900. This means that 90 degrees corresponds to 72,900 cars.
To find the total number of cars sold, we first need to determine how many cars correspond to one degree. We can do this by dividing the number of cars sold for Model D by the degrees it represents:
The total degrees in a pie chart is always 360 degrees.
Now, we can find the total number of cars sold by multiplying the value of one degree by the total degrees in the pie chart:
The total number of cars sold of all models together by the company is 291,600 cars.
Similar Questions
The given pie-chart shows the distribution (in degrees) of cars sold of difference models by a company in 2015-16.

If number of cars sold of model C are 22000, then what will be the difference in the number of cars sold of models A and B ?
View SolutionThe given pie-chart shows the distribution (in degrees) of cars sold of difference models by a company in 2015-16.

If 5% of the total number of cars sold of model E is 750, then what is the average number of cars sold of all the models ?
View Solutionthis table 6 Shows the number of cars sold in different showrooms during the year. If the total number of cars sold by all the three showrooms in six years is shown in the form of a pie-chart, then the year 2013 What is the central angle of the sector representing the total number of cars sold in India?
View SolutionThe given pie-chart shows the percentage distribution of sales of a specific brand of car from five showrooms A, B, C, D and E during 2018. The total number of cars sold from all the five showrooms during that year is 5000. Find the total number of cars sold from showrooms B and D together.
View SolutionRead the following table carefully and answer the questions given below. Number of Cars (In thousands) of different models and colours sold in two Metro Cities in a year

The total number of blue-coloured cars of model E and D sold in Metro H is exactly equal to the number of white-coloured cars of which model in Metro M?
View SolutionRead the following table carefully and answer the questions given below. Number of Cars (In thousands) of different models and colours sold in two Metro Cities in a year

What is the difference between the number of blue-colour cars of model 'C' sold in Metro M and number of red-colour cars of model F sold in Metro H?
View SolutionThe given table represents the sale (in thousands) of cars by four companies A, B, C and D in six years. Study the table and answer the question that follows. The total number of cars sold by company C in 2018 exceeds the average number of cars sold by company A during 2014 to 2018 by:
View SolutionThe given table represents the sale (in thousands) of cars by four companies A,B,C and D in six years. Study the table and answer the questions that follow. The total number of cars sold by companies A in 2017 and C in 2013 is what percentage of the total number of cars sold by all the four companies in 2013 and 2016?(correct to one decimal place)
दी गयी तालिका चार कंपनियों - A, B, C और D के द्वारा छः वर्षों में की गयी कारों की बिक्री ( हज़ार में ) दर्शाती है | इस तालिका का अध्ययन करें तथा फिर पूछे गए प्रश्नों के उत्तर दें |
कंपनी A के द्वारा 2017 में तथा कंपनी C के द्वारा 2013 में बेची गयी कारों की कुल संख्या सभी चार कंपनियों के द्वारा 2013 से 2016 तक बेची गयी कारों की कुल संख्या का कितना प्रतिशत है ? ( दशमलव के एक स्थान तक )
View Solution