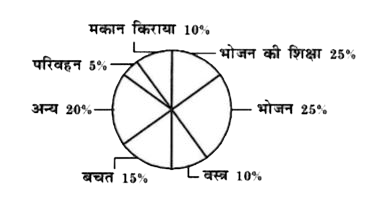
The following pie-chart shows the monthly expenditure of a family on food, house rent clothing, education, fuel and miscellaneous Study the pie-chart
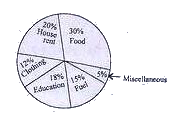
Total percentage of expenditure on house rent, clothing and fuel is greater than the percentage of expenditure on food by
16
17
18
20
Step by step video solution for The following pie-chart shows the monthly expenditure of a family on food, house rent clothing, education, fuel and miscellaneous Study the pie-chart Total percentage of expenditure on house rent, clothing and fuel is greater than the percentage of expenditure on food by by Maths experts to help you in doubts & scoring excellent marks in Class 14 exams.
Updated on:21/07/2023Similar Questions
The Expenditure of a family in a month is represented by a Pie-chart. Read it carefully to answer the questions.
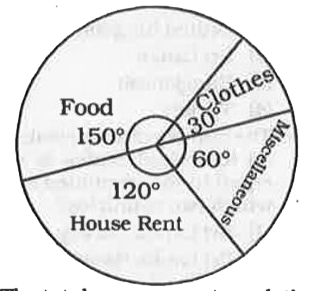
The percentage of money spent on food compared to house rent is
View SolutionThe pie chart given below shows the expenditure (in percentage) of Mahesh. The monthly income of Mahesh is Rs. 26000.
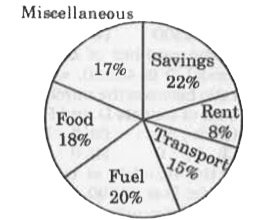
What will be the approximate difference (in Rs.) between the average expenditure on Savings, Rent and Fuel and average expenditure on Food. Transport and Savings?
View SolutionThe given pie-chart shows the breakup (in percentage) of monthly expenditure of a person.
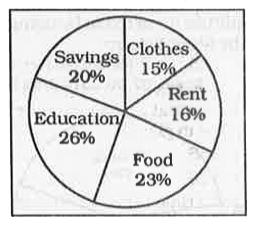
If the expenditure incurred on Clothes is Rs. 3000, what is the expenditure (in Rs.) incurred on Education?
View Solutionसंलग्न पाई चार्ट एक महीने में एक परिवार के विभिन्न मर्दों में से व्यय और उसकी बचत ( प्रतिशतों में) दर्शाता है।
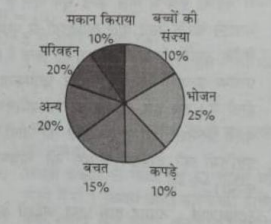
यदि परिवार की मासिक आय ₹ 3000 है, तो कपड़ों पर मासिक व्यय क्या है ?
View SolutionThe following pie-chart shows the monthly expenditure and savings of a family on food, clothing, rent, miscellaneous expenses. What is the middle angle of savings?
View SolutionSome expenditure in degree corresponding to the following expenditure =43200 rupees In the given pie-chart the total expenditure on rent and education together is what percent less than the total expenditure on food and miscellaneous items together?
View SolutionThe following pie-chart shows the monthly expenditure incurred by a family on various items , and their , and their savings . Study the chart and answer the question that follows. If the expenditure on education is ₹ 2,700 more than on housing , then the total expenditure on food and clothing is :
View SolutionThe following pie-chart shows the monthly expenditure of a family on food, clothing, rent, miscellaneous expenses and savings. What is the central angle for savings?
View Solution
