Which of the following diagram correctly describes the behaviour of a fixed mass of an ideal gas ? (T is measured in K)
The correct Answer is:A, B, C, D
To determine which diagram correctly describes the behavior of a fixed mass of an ideal gas, we can analyze the relationships between pressure (P), volume (V), and temperature (T) using the ideal gas law, which is given by:
PV=nRT
Where:
- P = pressure
- V = volume
- n = number of moles of gas (constant for fixed mass)
- R = ideal gas constant
- T = temperature in Kelvin
1. Understanding the Ideal Gas Law:
- The ideal gas law states that for a fixed mass of gas, the product of pressure and volume is proportional to the temperature.
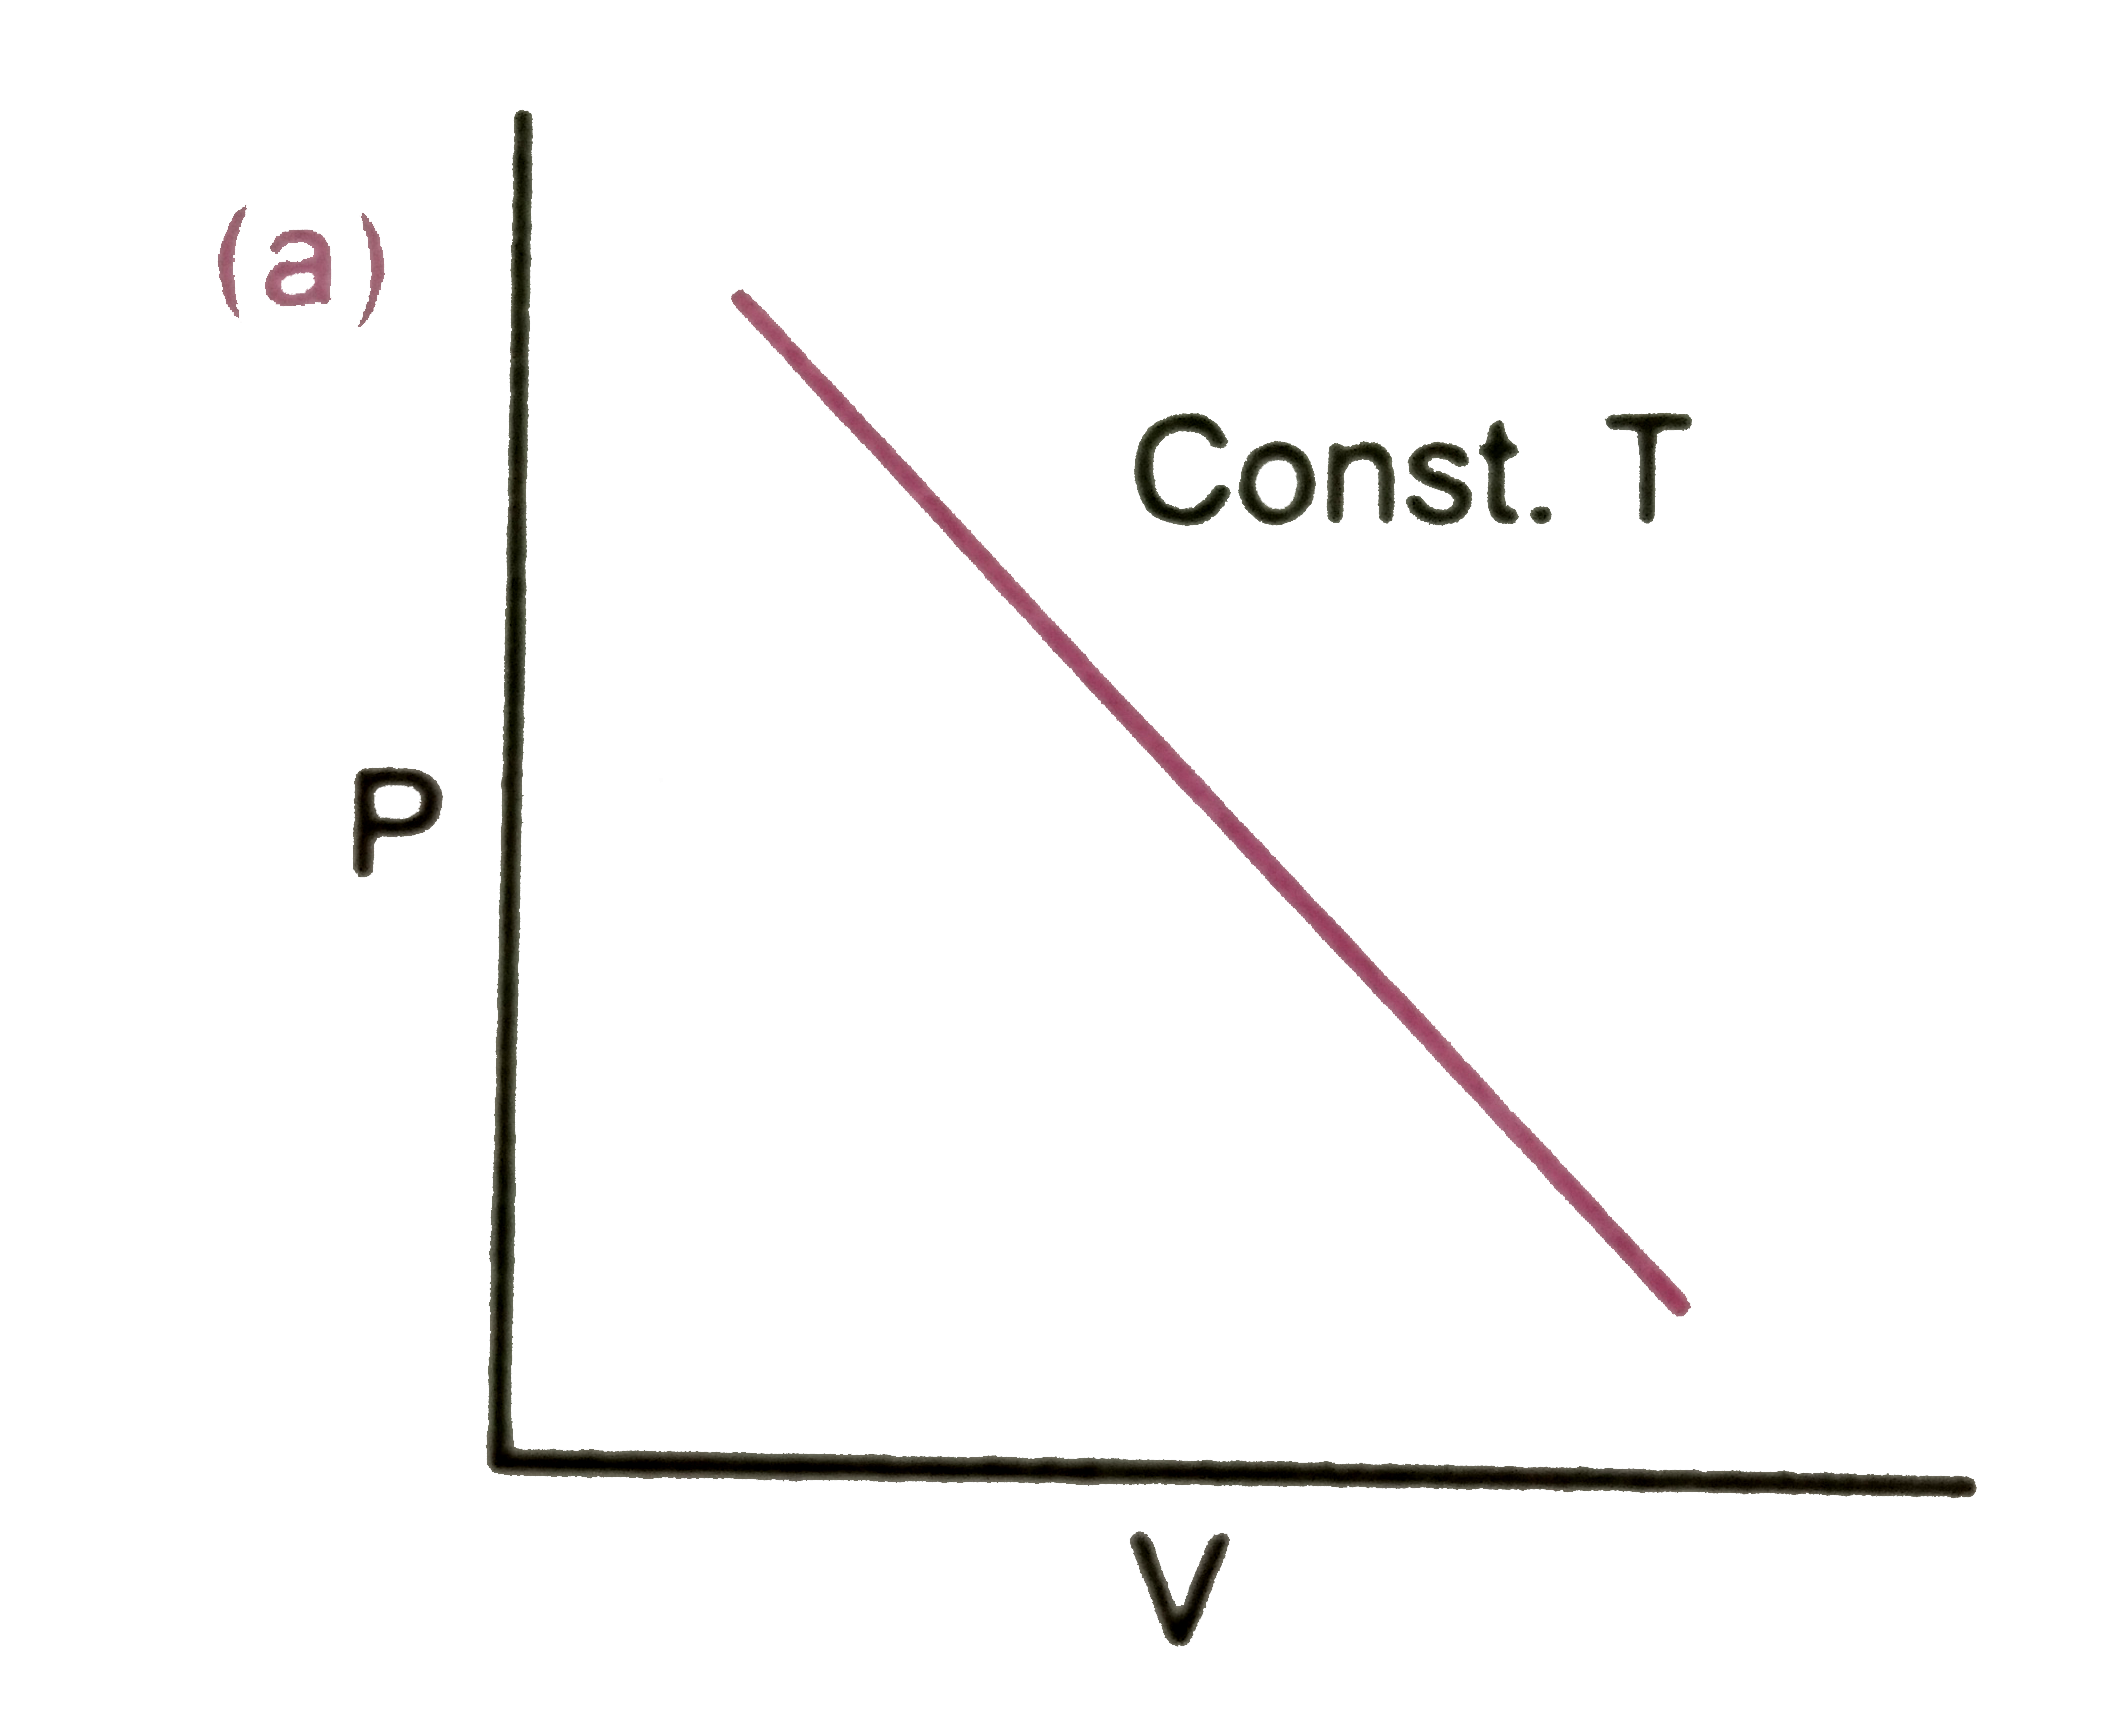
2. Analyzing the First Graph (P vs. V at Constant T):
- If temperature (T) is constant, then from the ideal gas equation, we can express it as:
P∝1V
- This indicates that pressure is inversely proportional to volume, which means the graph of P vs. V should be a hyperbola, not a straight line. Therefore, the first graph is incorrect.
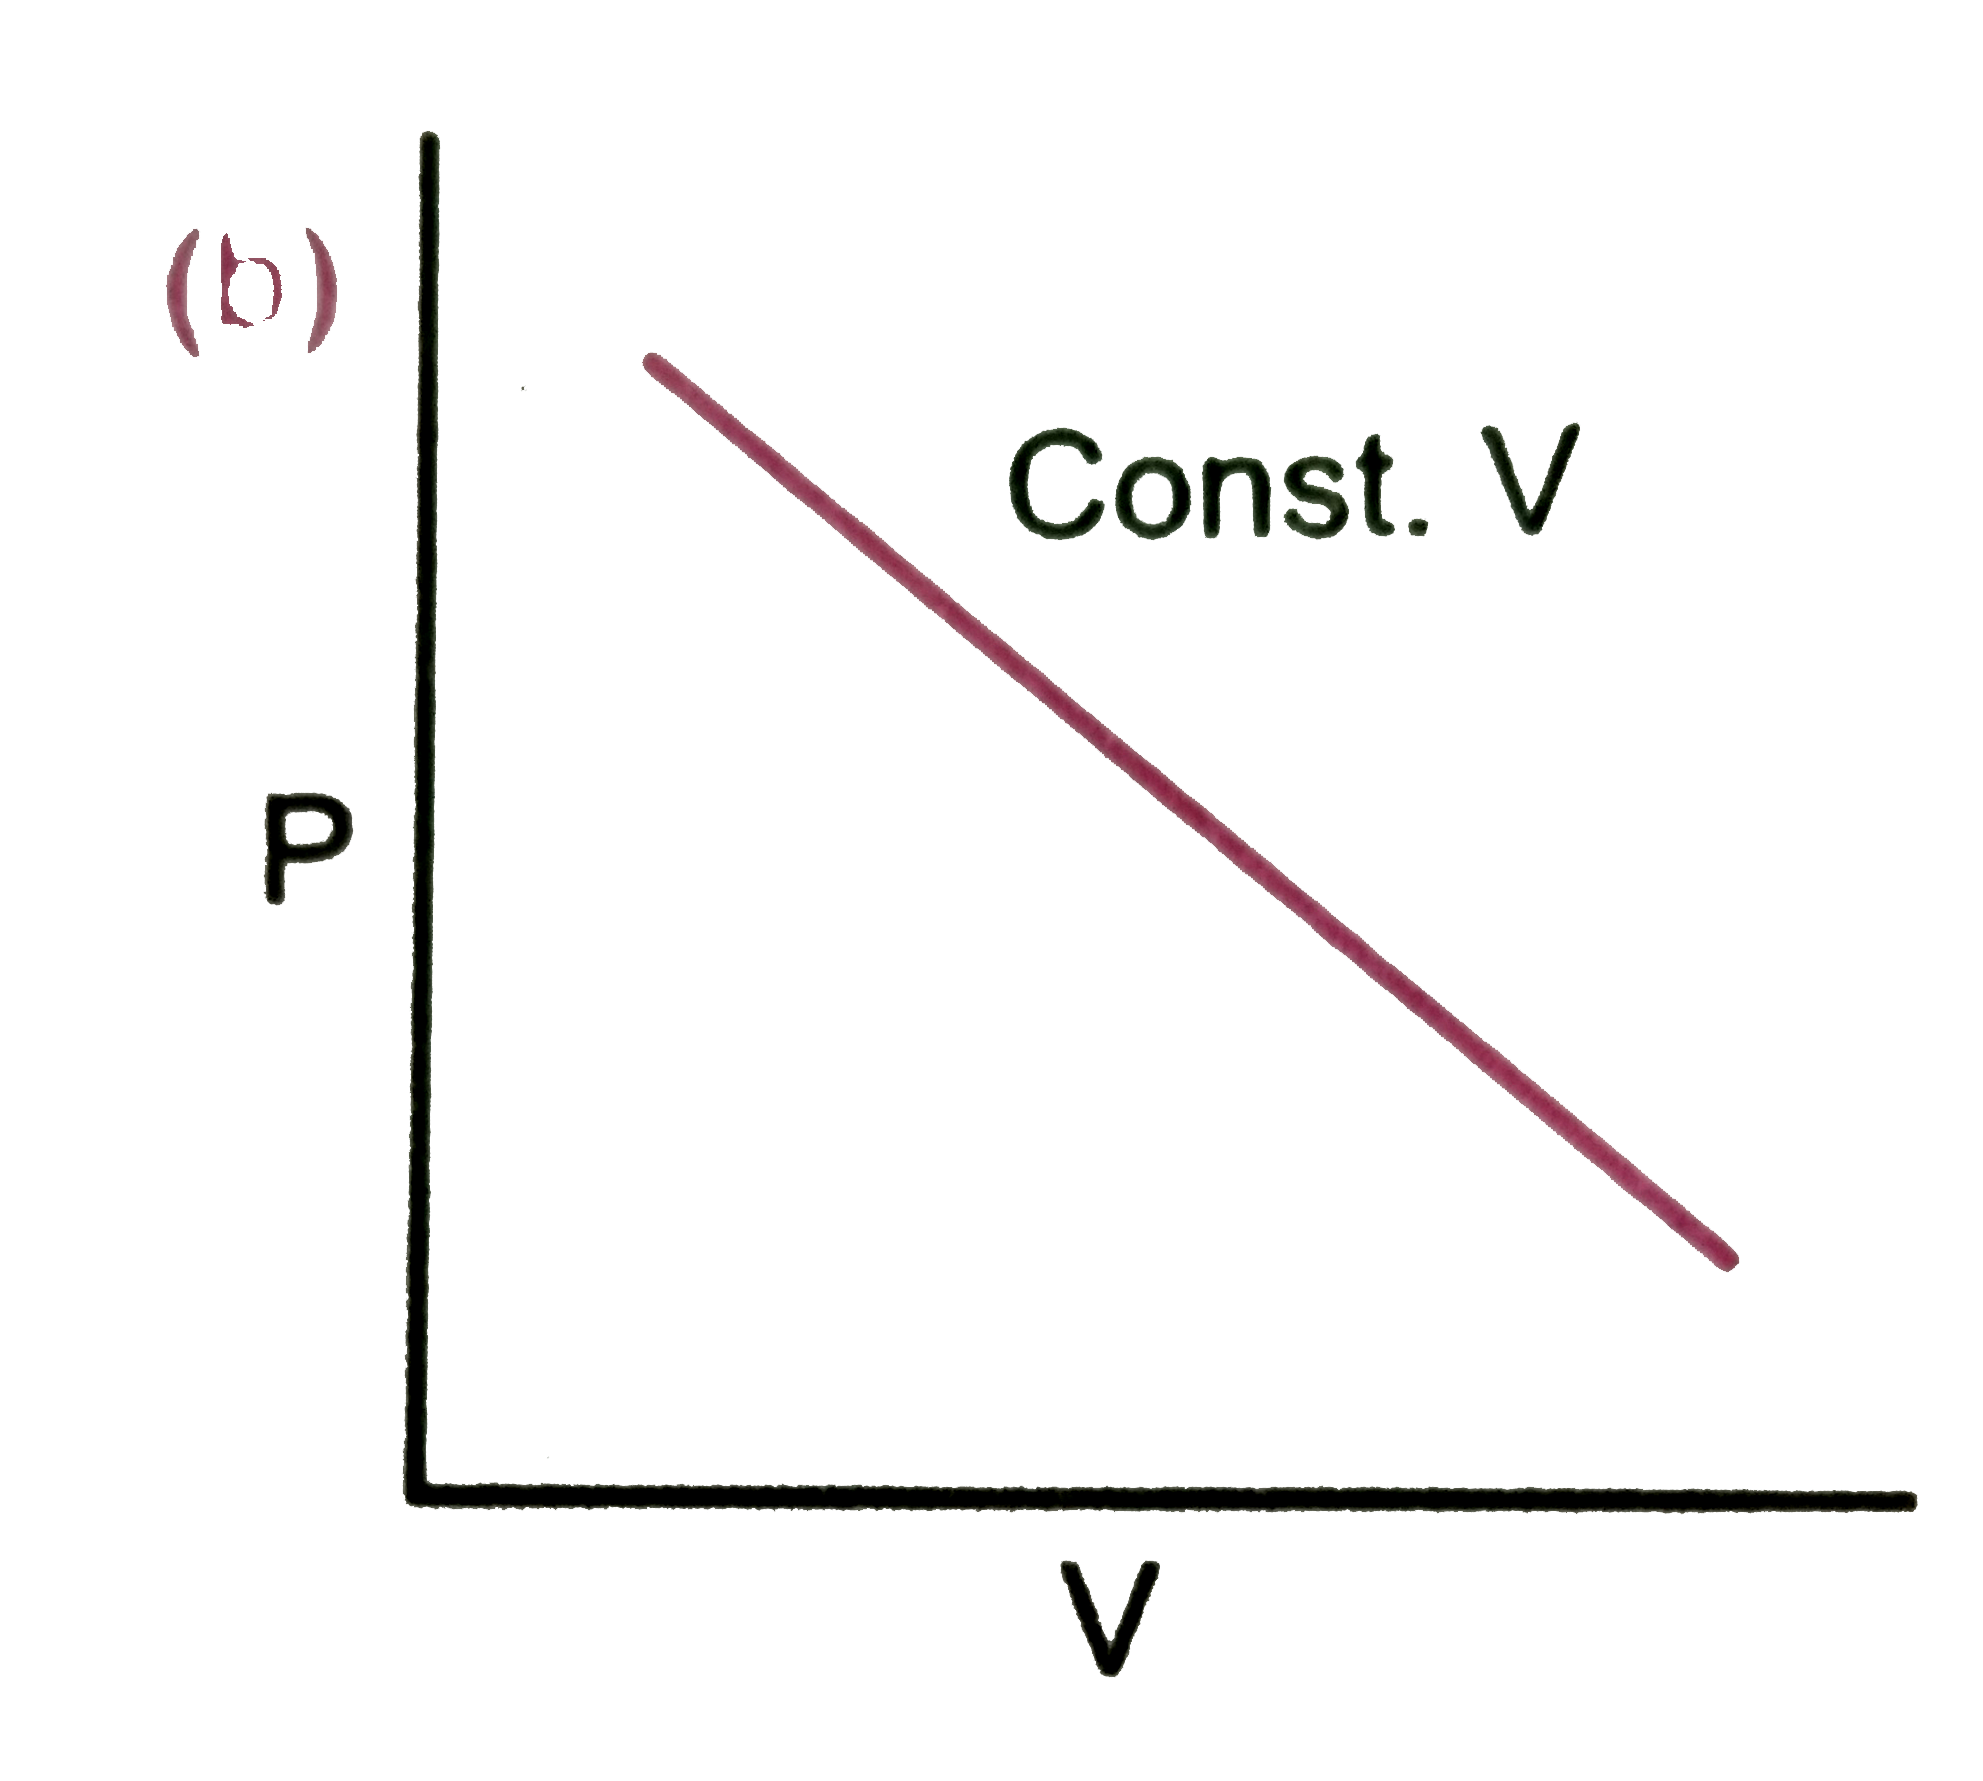
3. Analyzing the Second Graph (P vs. T at Constant V):
- If volume (V) is constant, we can rearrange the ideal gas law to show:
P∝T
- This means that pressure increases linearly with temperature. The graph of P vs. T at constant volume should be a straight line. However, if the graph is not a straight line, this option is incorrect.
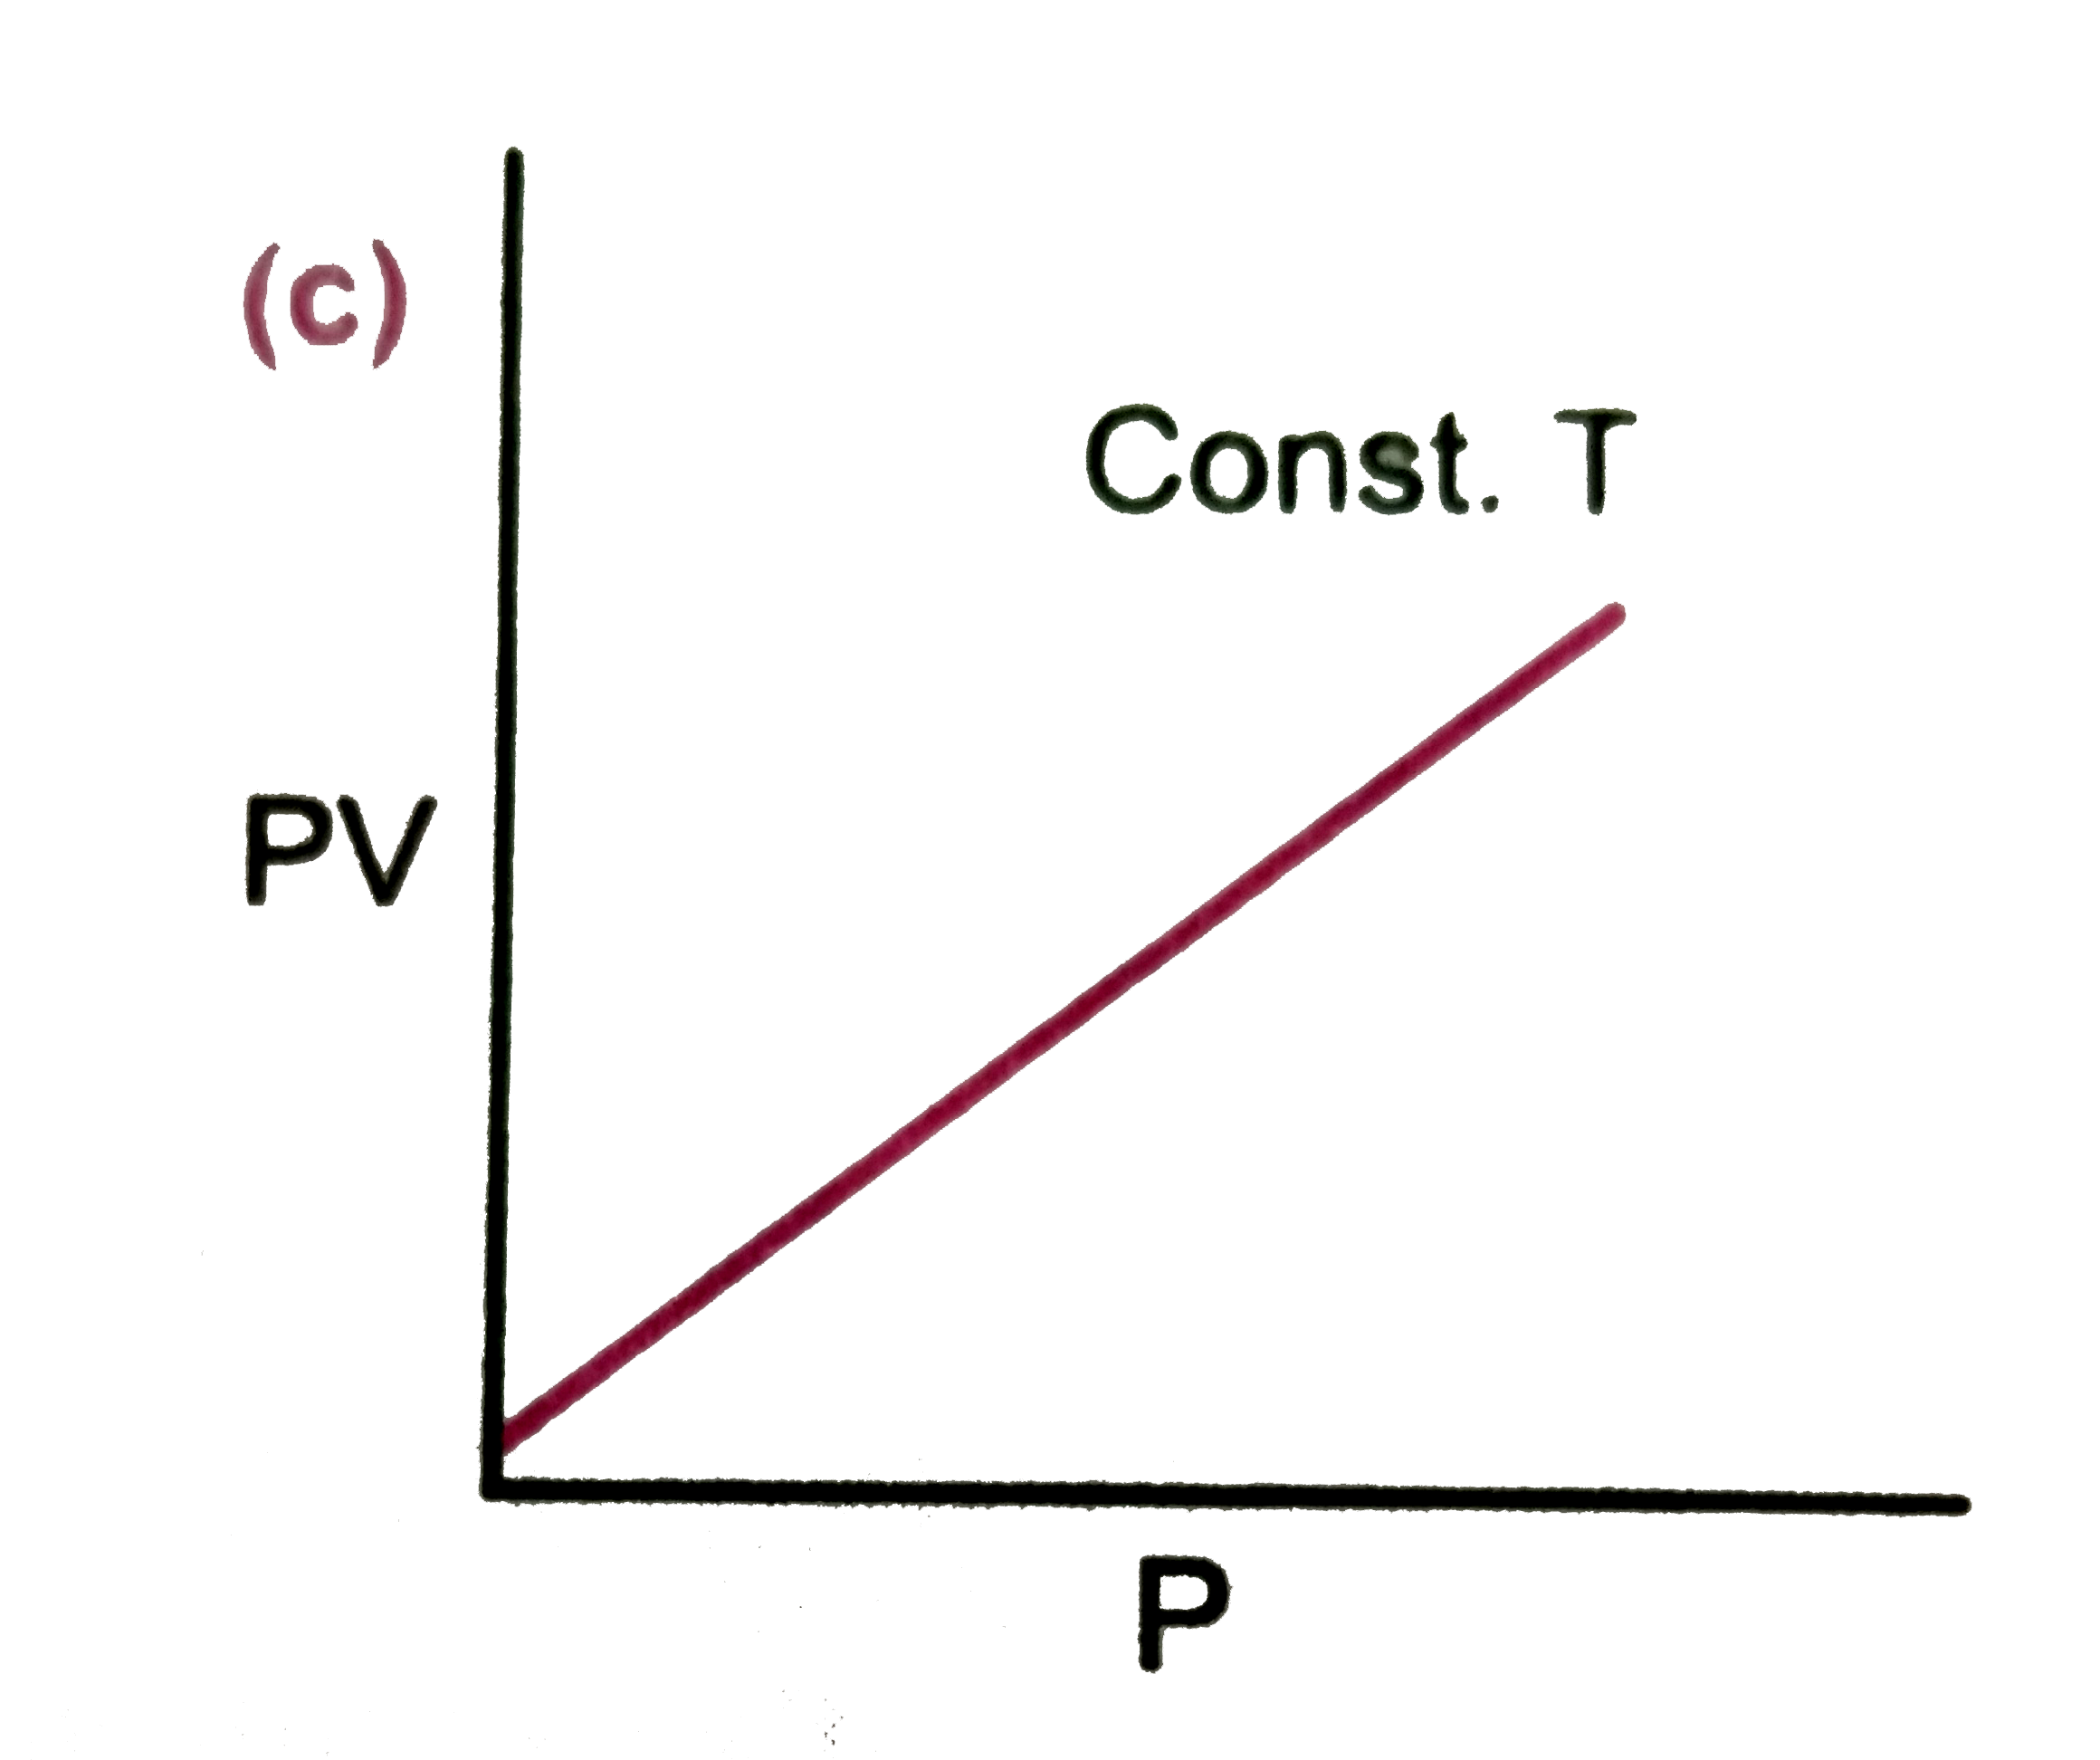
4. Analyzing the Third Graph (PV vs. P at Constant T):
- Here, if we consider the product PV at constant temperature, we see:
PV=nRT
- Since PV is constant, this means that the graph of PV vs. P should also be constant. If the graph shows any variation, this option is also incorrect.
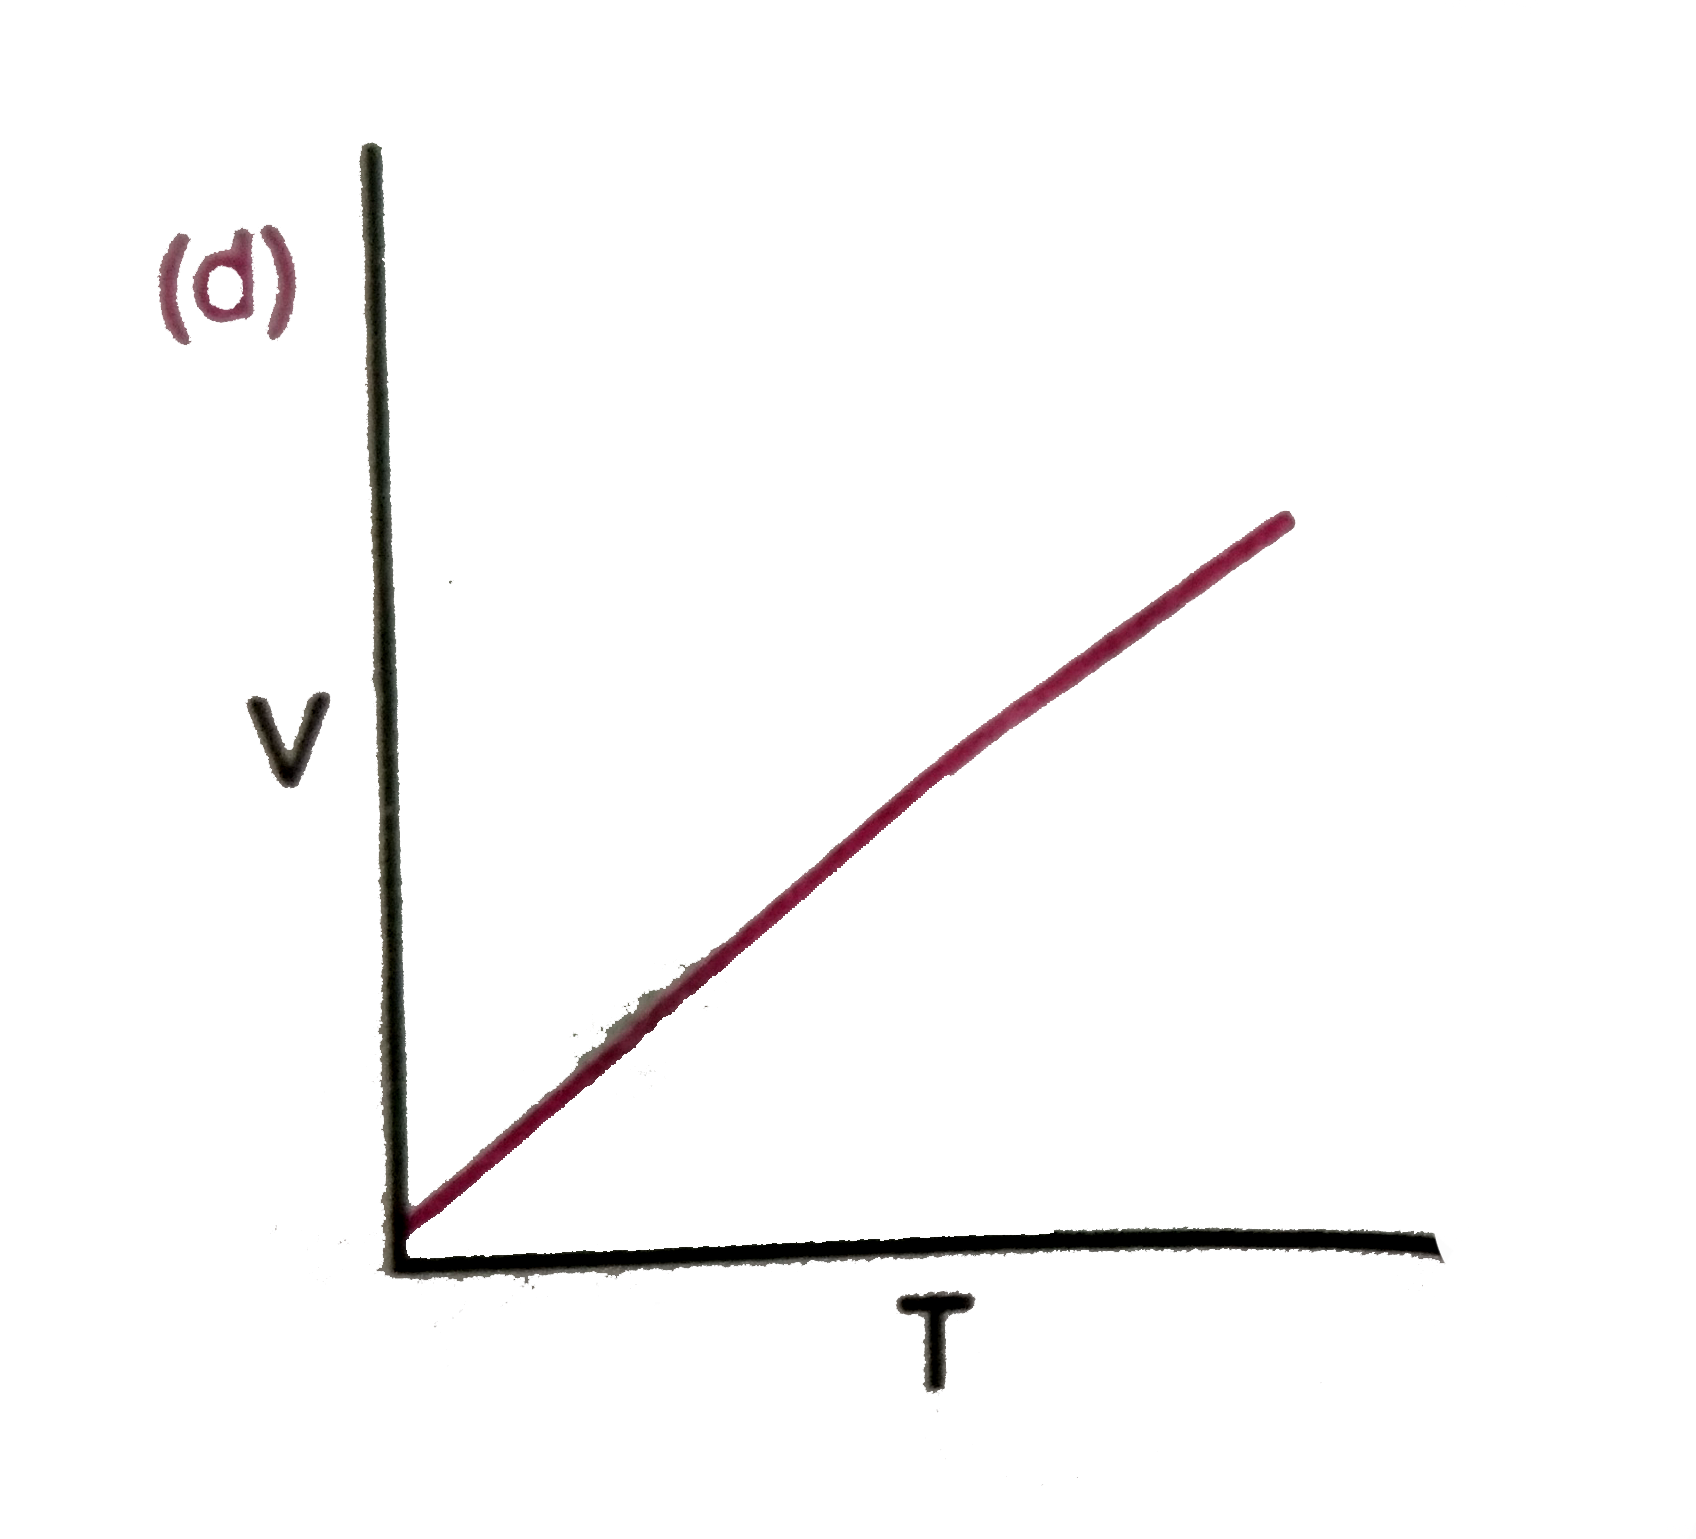
5. Analyzing the Fourth Graph (V vs. T at Constant P):
- If pressure (P) is constant, we can rearrange the ideal gas law to show:
V∝T
- This indicates a direct linear relationship between volume and temperature. Thus, the graph of V vs. T at constant pressure should be a straight line. If this graph is indeed a straight line, then this option is correct.
Conclusion:
The correct diagram that describes the behavior of a fixed mass of an ideal gas is the fourth graph, which shows a linear relationship between volume (V) and temperature (T) at constant pressure (P).
- P = pressure
- V = volume
- n = number of moles of gas (constant for fixed mass)
- R = ideal gas constant
- T = temperature in Kelvin
- The ideal gas law states that for a fixed mass of gas, the product of pressure and volume is proportional to the temperature.
- If temperature (T) is constant, then from the ideal gas equation, we can express it as:
P∝1V
- This indicates that pressure is inversely proportional to volume, which means the graph of P vs. V should be a hyperbola, not a straight line. Therefore, the first graph is incorrect.
- If volume (V) is constant, we can rearrange the ideal gas law to show:
P∝T
- This means that pressure increases linearly with temperature. The graph of P vs. T at constant volume should be a straight line. However, if the graph is not a straight line, this option is incorrect.
- Here, if we consider the product PV at constant temperature, we see:
PV=nRT
- Since PV is constant, this means that the graph of PV vs. P should also be constant. If the graph shows any variation, this option is also incorrect.
- If pressure (P) is constant, we can rearrange the ideal gas law to show:
V∝T
- This indicates a direct linear relationship between volume and temperature. Thus, the graph of V vs. T at constant pressure should be a straight line. If this graph is indeed a straight line, then this option is correct.
The correct diagram that describes the behavior of a fixed mass of an ideal gas is the fourth graph, which shows a linear relationship between volume (V) and temperature (T) at constant pressure (P).
Topper's Solved these Questions
- STATES OF MATTER : GASES AND LIQUIDESBook:PRADEEPChapter:STATES OF MATTER : GASES AND LIQUIDESExercise:FILL IN THE BLANK
Explore 20 Videos
- STATES OF MATTER : GASES AND LIQUIDESBook:PRADEEPChapter:STATES OF MATTER : GASES AND LIQUIDESExercise:CONCEPTUAL QUESTIONS (Differentiating three states of matter and intermolecular forces
Explore 2 Videos
- STATES OF MATTER : GASES AND LIQUIDESBook:PRADEEPChapter:STATES OF MATTER : GASES AND LIQUIDESExercise:ADVANCED PROBLEMS (FOR COMPETITIONS)
Explore 18 Videos
- SOME p-BLOCK ELEMENTSBook:PRADEEPChapter:SOME p-BLOCK ELEMENTSExercise:Competition Focus (JEE( Main and Advanced)/Medical Entrance) VIII. Assertion-Reason Type Questions (Type I)
Explore 23 Videos
- STATES OF MATTER: SOLID MATTERBook:PRADEEPChapter:STATES OF MATTER: SOLID MATTERExercise:COMPETITION FOCUS (ASSERTION-REASON)
Explore 17 Videos
Similar Questions
Knowledge Check
Which of the following diagrams correctly decribes the behavior of a fixed mass of an ideal gas ? (T is measured in K)
A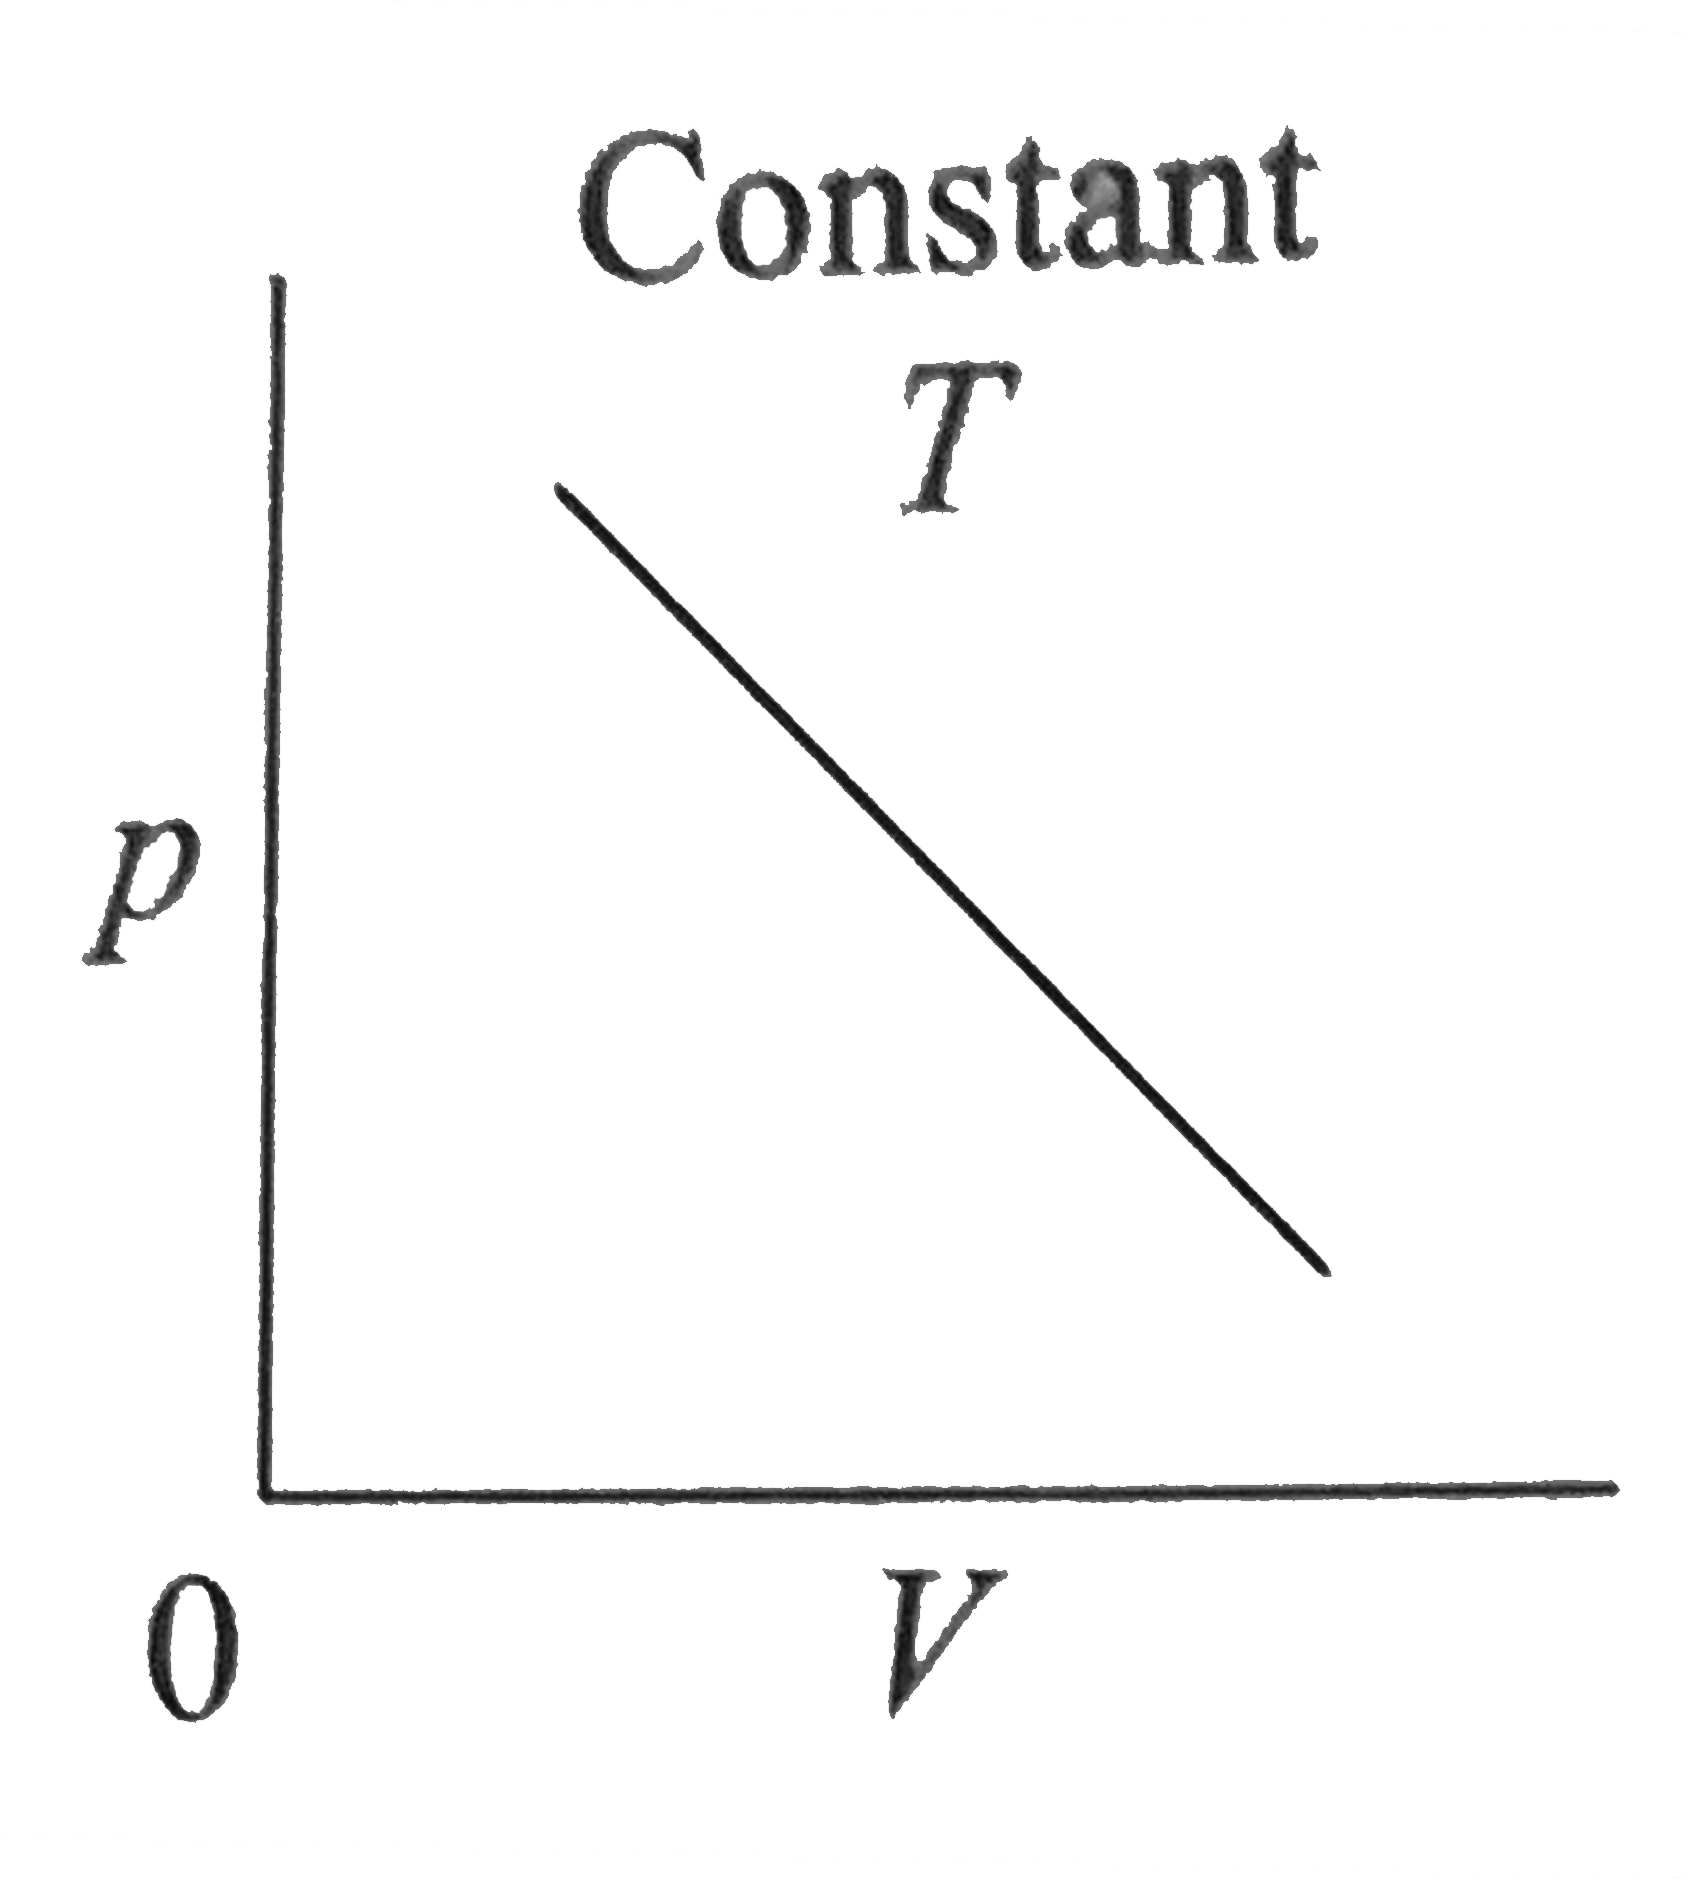 B
B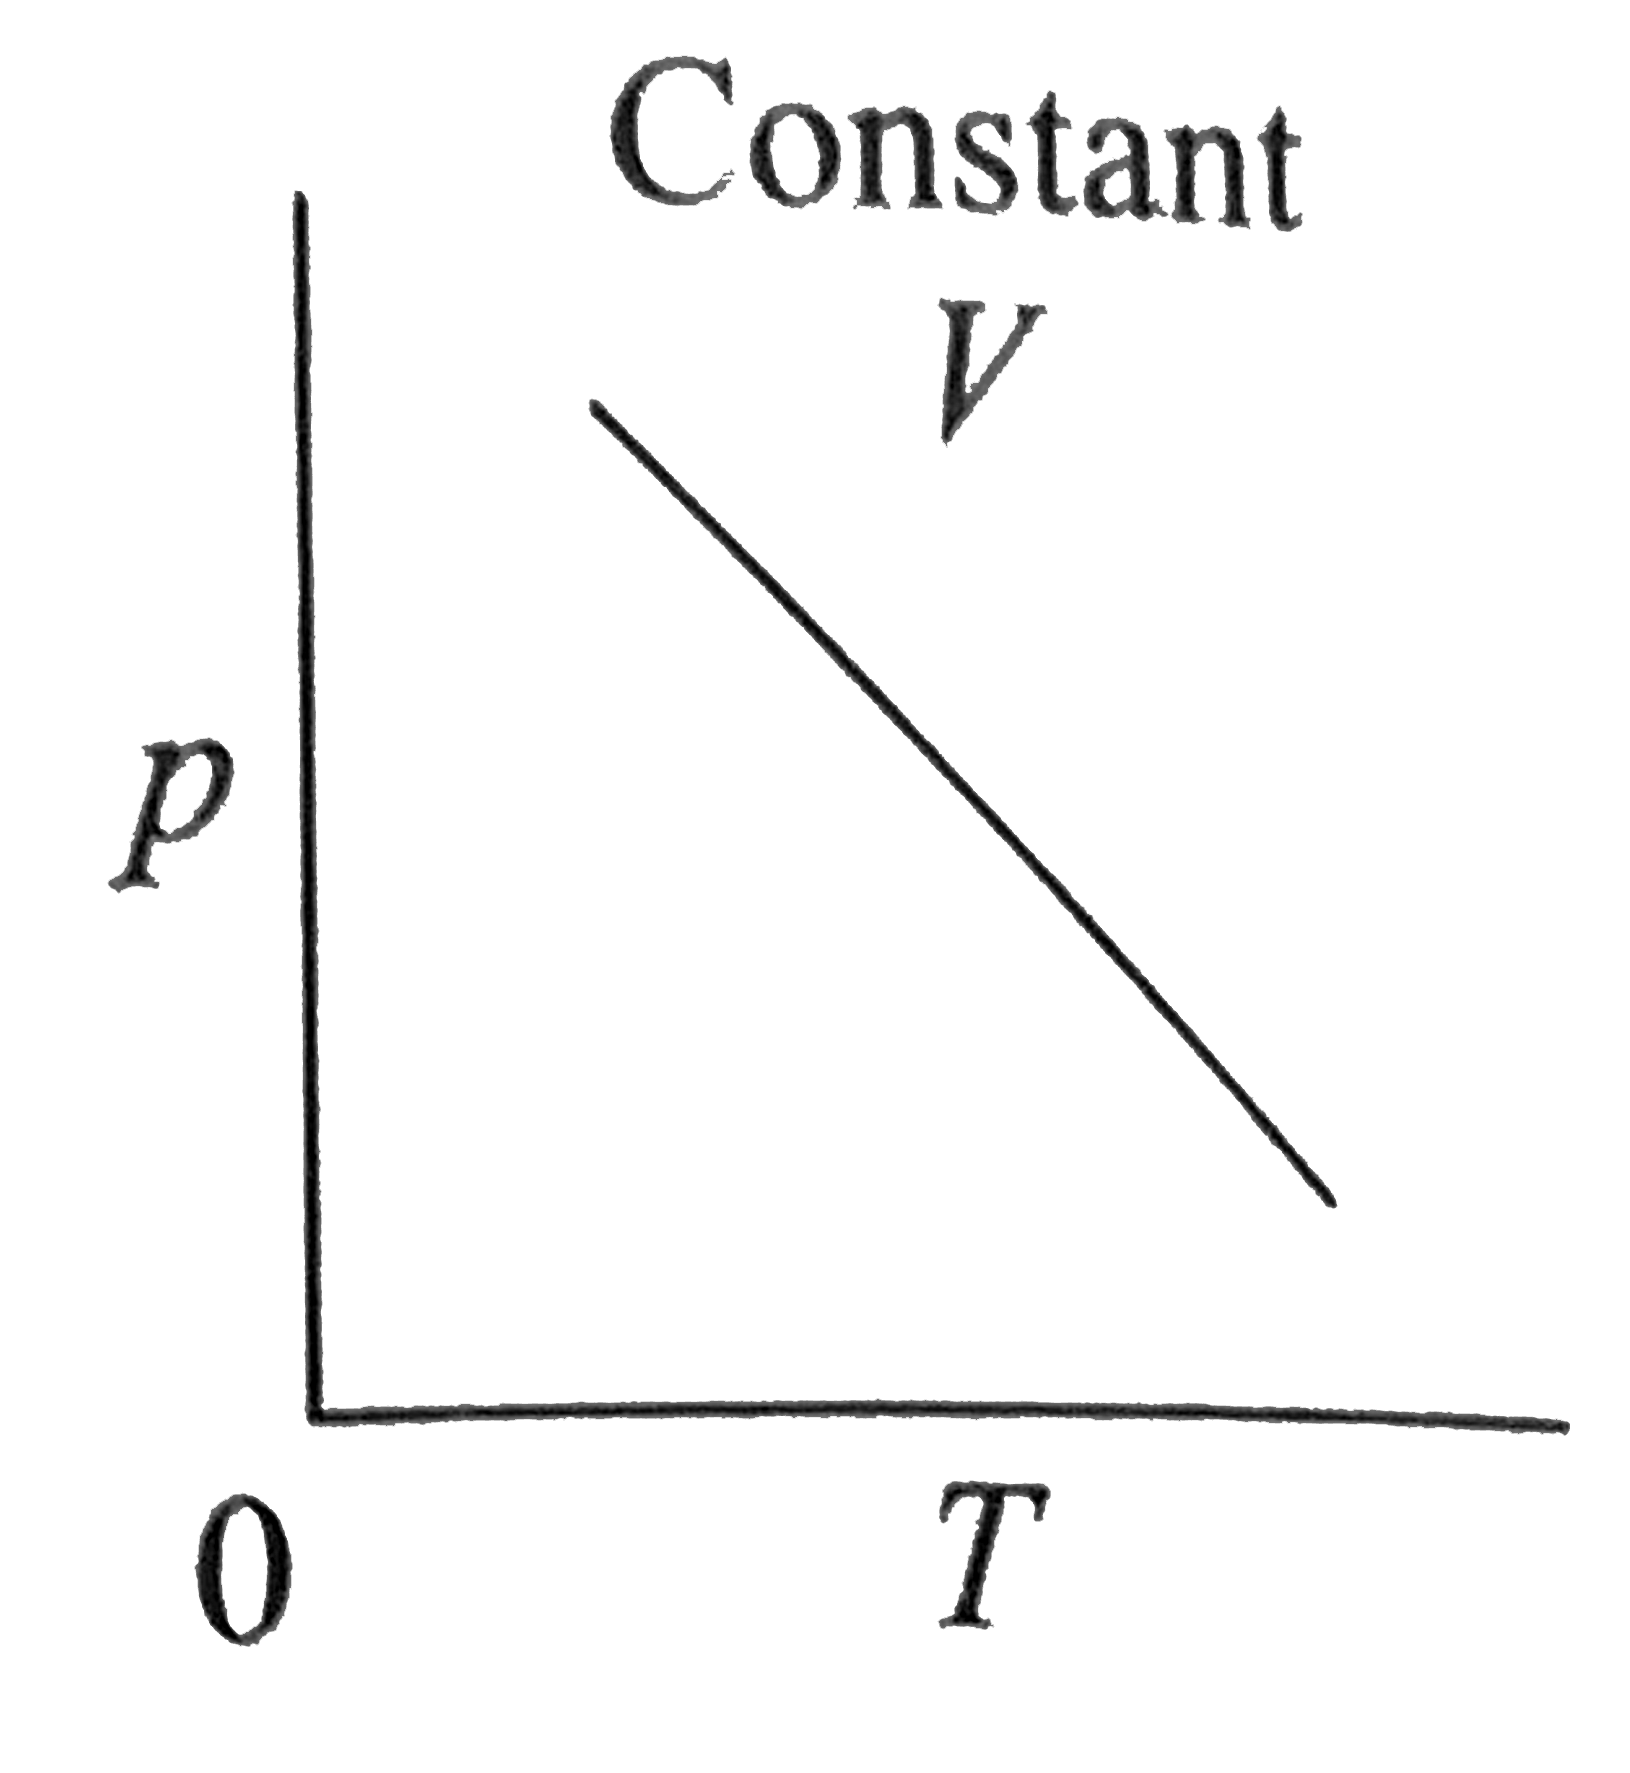 C
C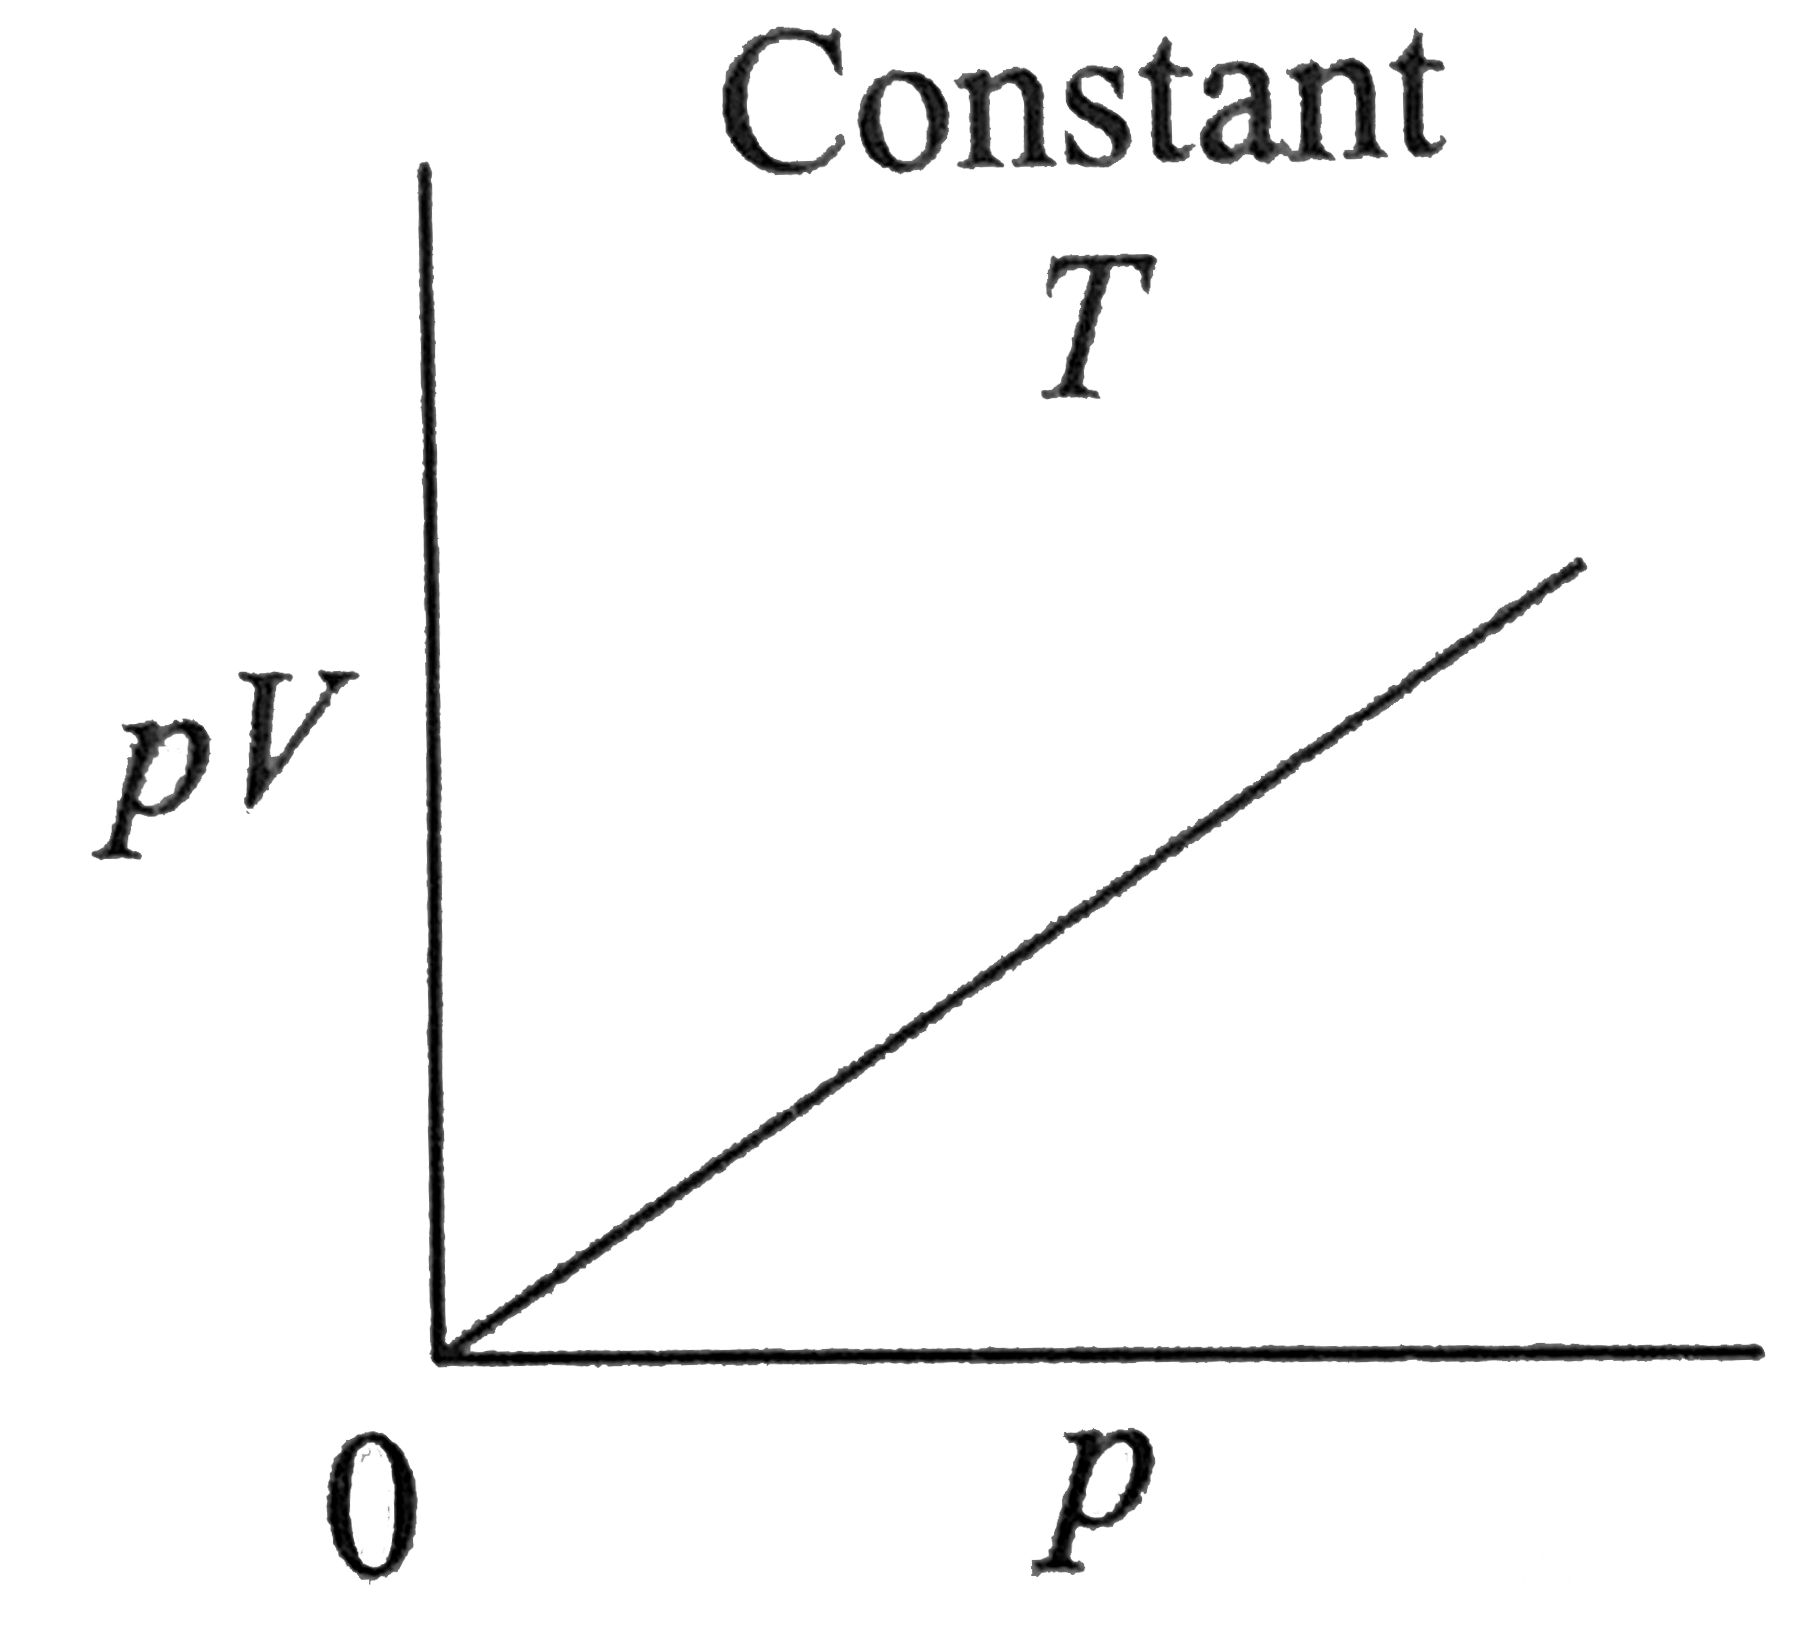 D
D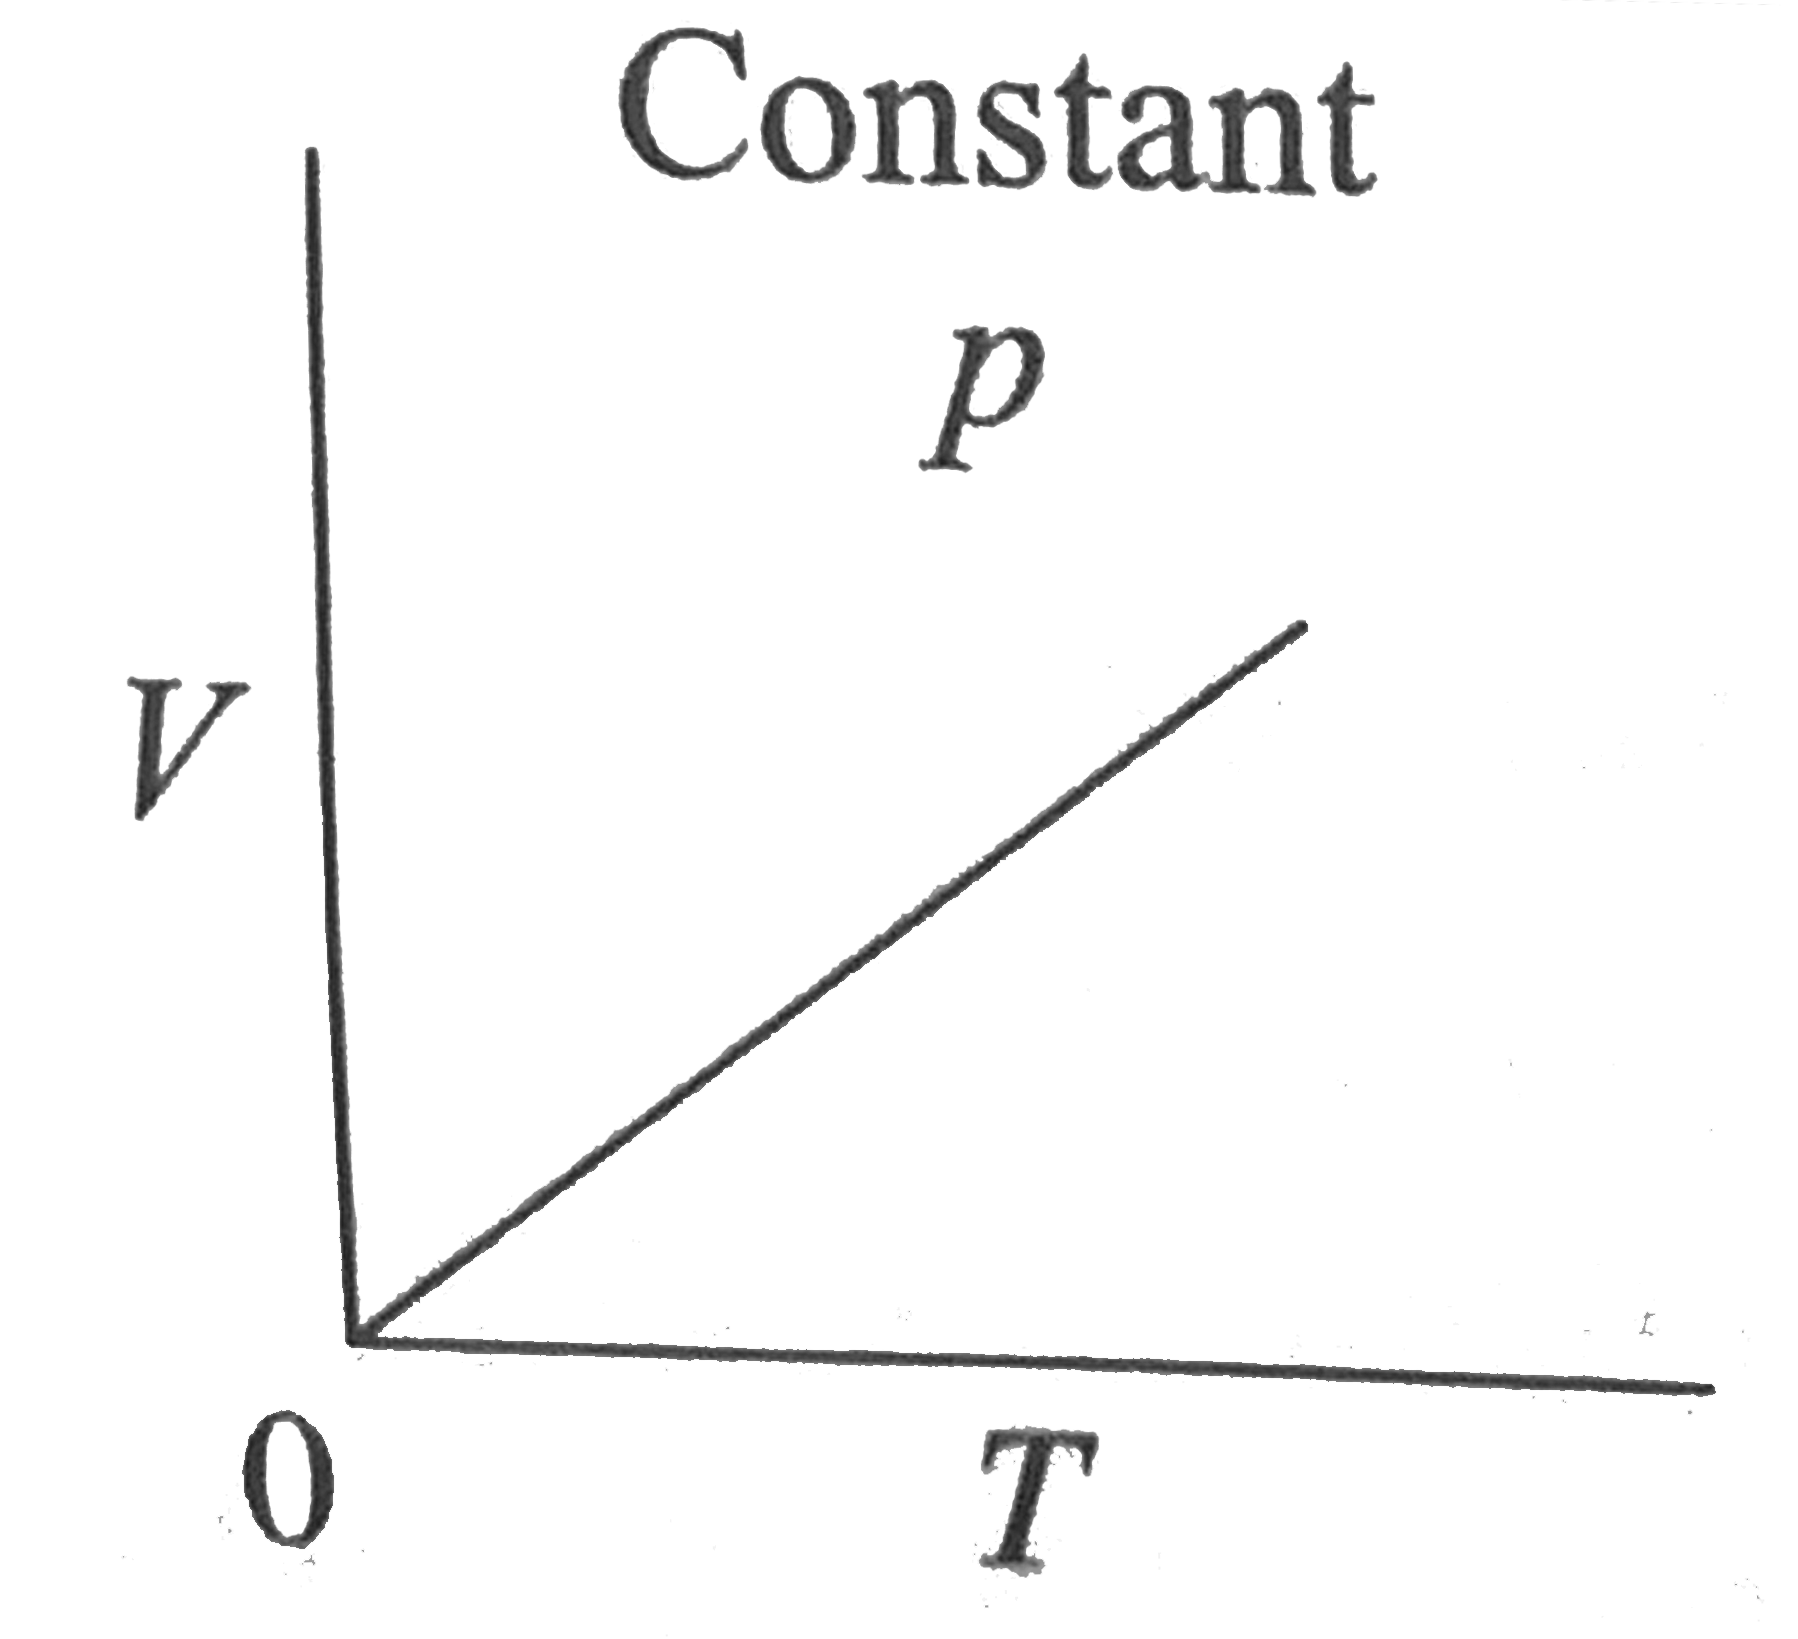
Which one of the following graphs correctly gives the ideal gas behaviour ?
A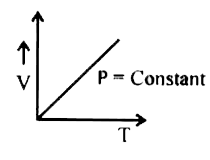 B
B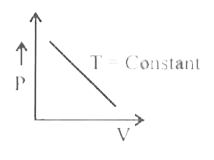 C
C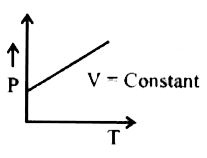 D
D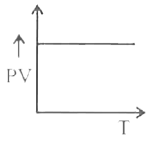
Which of the following diagrams, Fig. depicts ideal gas behaviour ?
A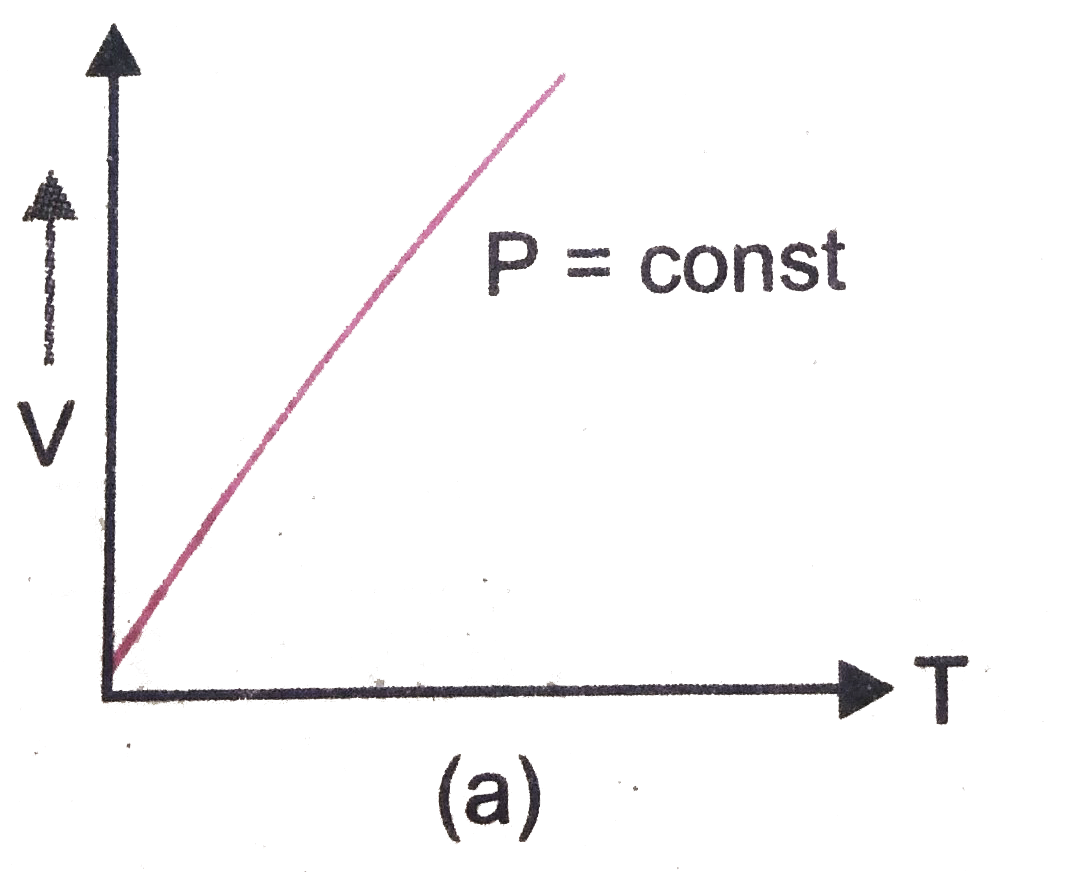 B
B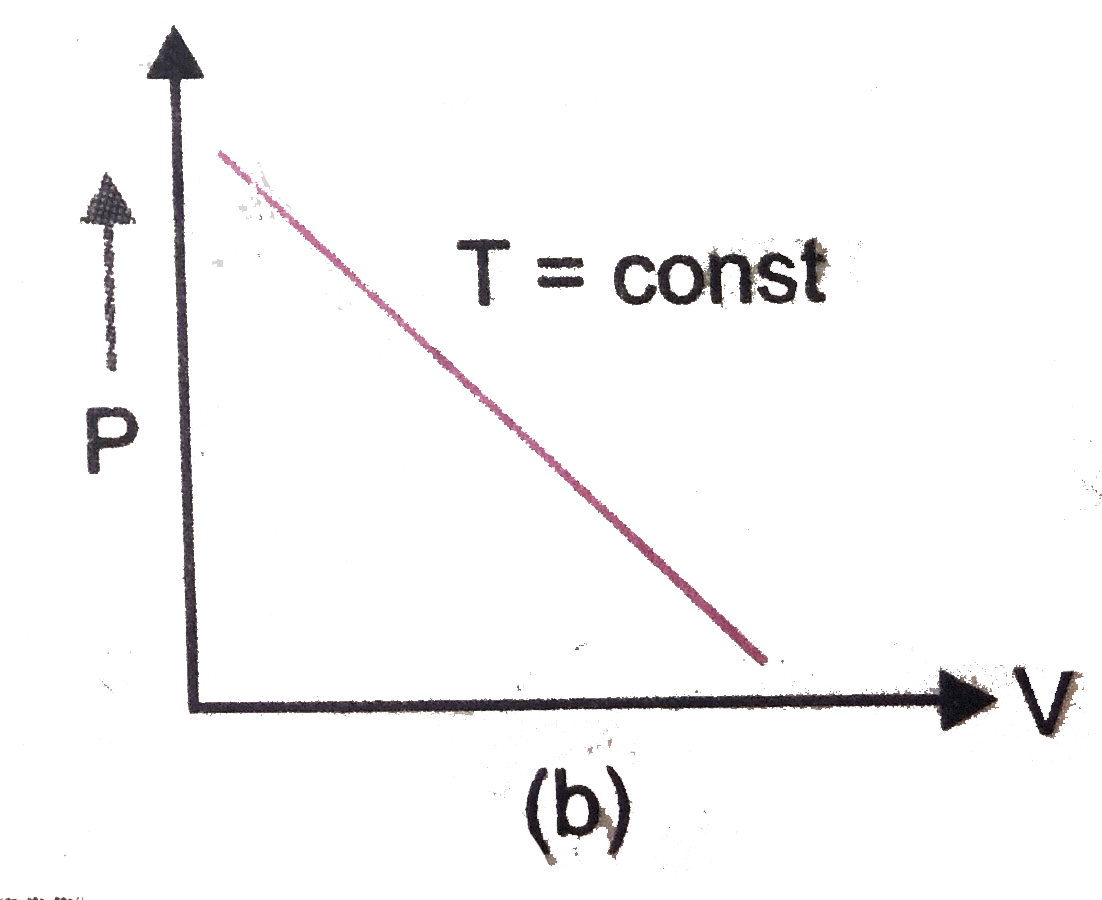 C
C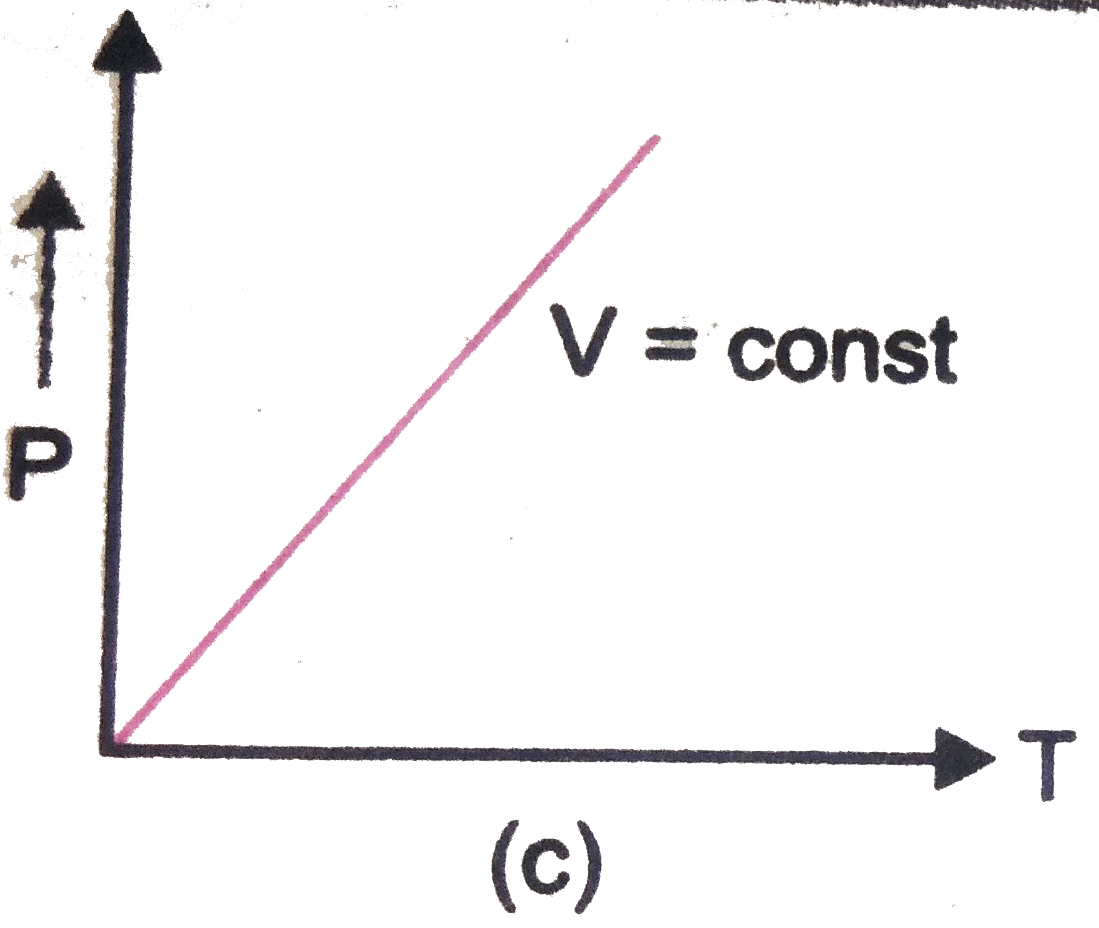 D
D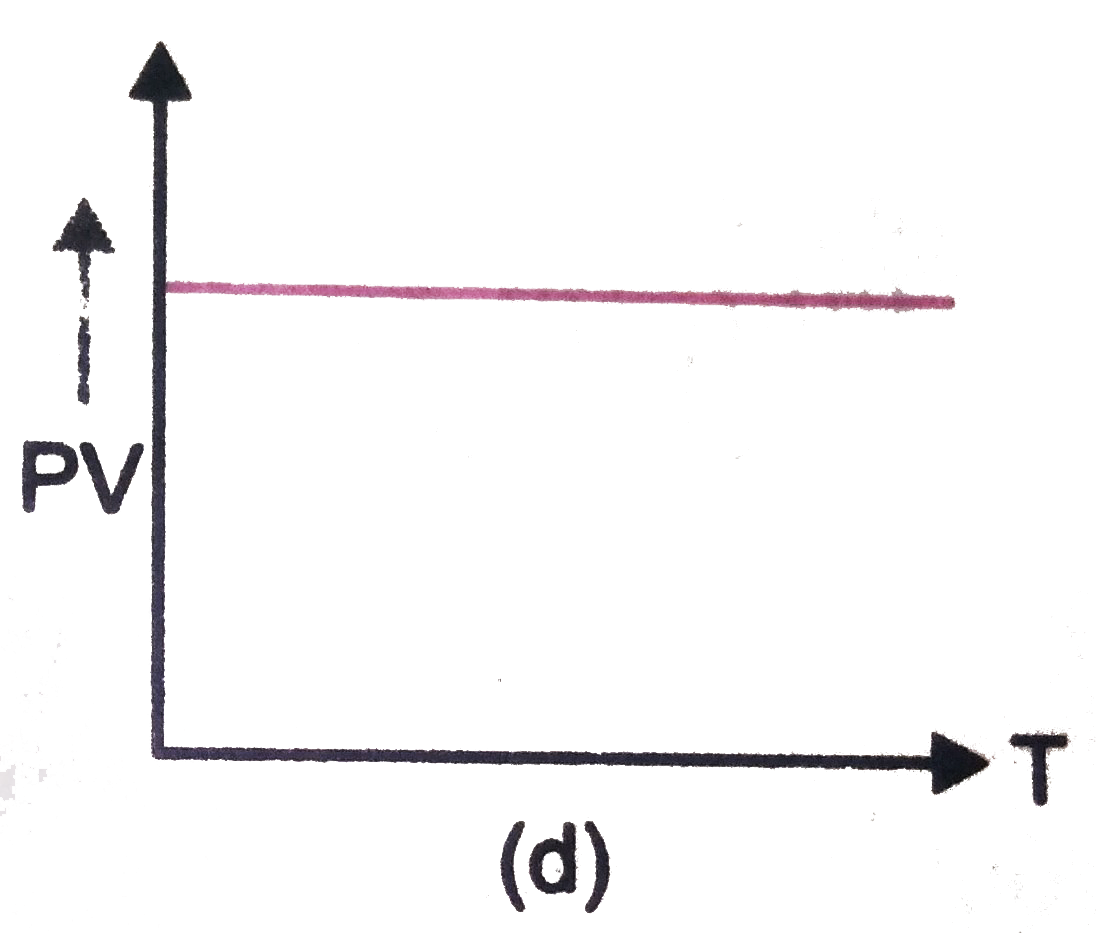
Which of the following graphs represent the behaviour of an ideal gas ?
View SolutionWhich of the following diagrams (figure) depicts ideal gas behaviour?
View SolutionWhich of the following graphs is consistent with ideal gas behaviour?
View SolutionWhich of the following measure the deviation from ideal behaviour of gas?
View SolutionWhich of the following demonstrates non-ideal behaviour of a gas?
View Solution

