Ellingham diagram represents change of
change of ΔG with temperature
change of ΔH with temperature
change of ΔG with pressure
change of (ΔG−TΔS) with temperature
The correct Answer is:A
Step by step video solution for Ellingham diagram represents change of by Chemistry experts to help you in doubts & scoring excellent marks in Class 12 exams.
Updated on:21/07/2023Topper's Solved these Questions
- METALLURGYBook:VK JAISWAL ENGLISHChapter:METALLURGYExercise:Level 2
Explore 86 Videos
- METALLURGYBook:VK JAISWAL ENGLISHChapter:METALLURGYExercise:Level 3 (Passive 1)
Explore 8 Videos
- ENVIRONMENTAL CHEMISTRYBook:VK JAISWAL ENGLISHChapter:ENVIRONMENTAL CHEMISTRYExercise:ASSERTION-REASON TYPE QUESTIONS
Explore 14 Videos
- p-BLOCK ELEMENTSBook:VK JAISWAL ENGLISHChapter:p-BLOCK ELEMENTSExercise:SUBJECTIVE PROBLEMS
Explore 35 Videos
Similar Questions
The given diagram represents

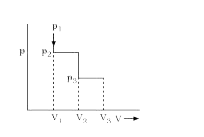
View SolutionThe following diagram represents the (p-V) changes of gas. Thus, total work done is:

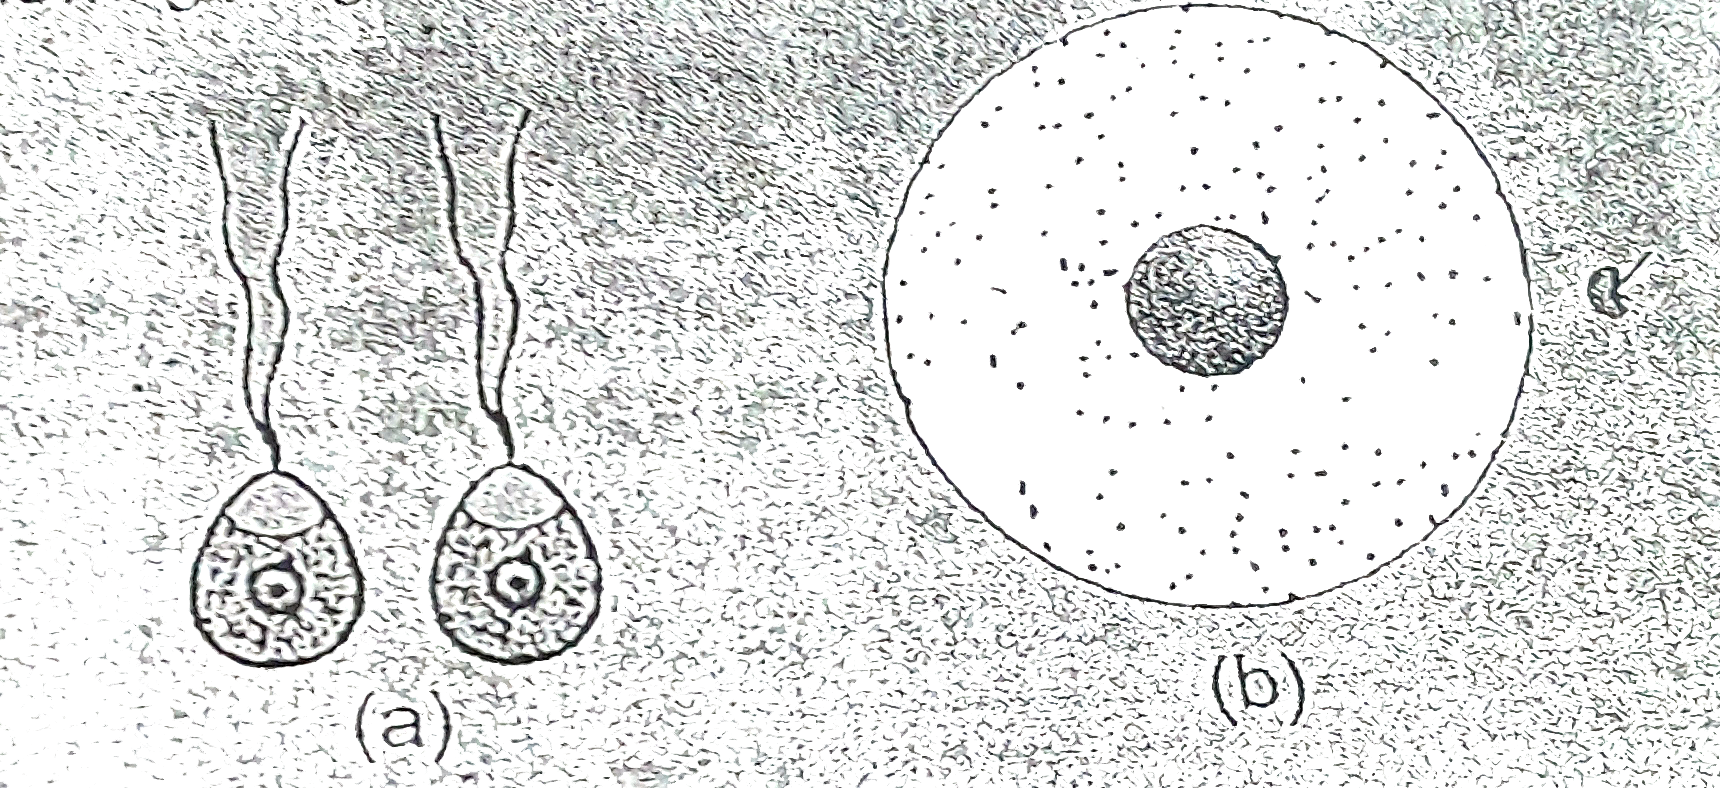
View SolutionWhat does the following diagram represent ?

View SolutionWhich of the following diagram represents axile placentation?
View SolutionWhich one of the following diagrams represents the placentation in Dianthus
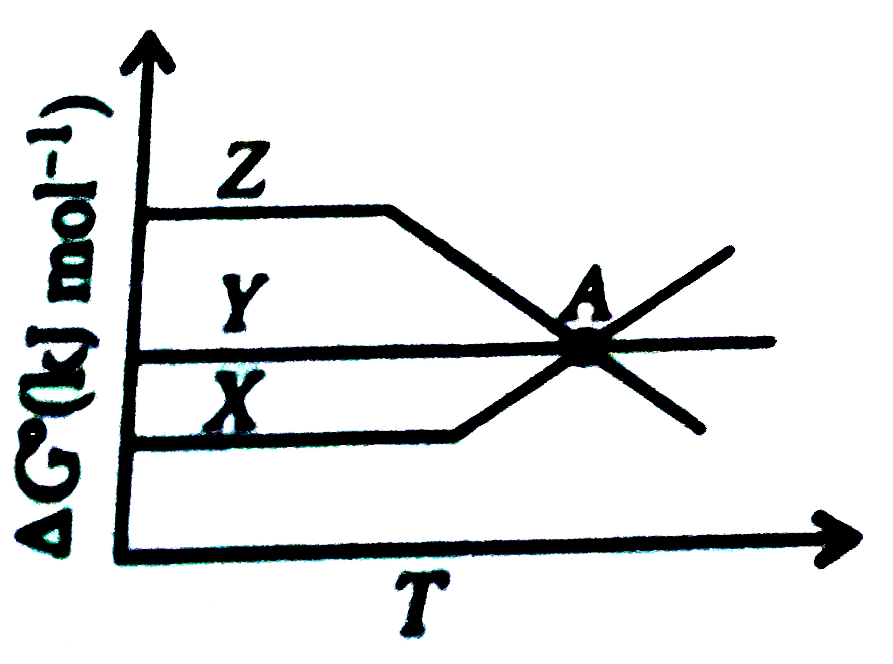
View SolutionIn the following Ellingham diagram ,X, Y and Z represent graphs for metal oxides . Select the correct option before point A.

View SolutionWith respect to an ore, Ellingham diagram helps to predict the feasiblity of its
View SolutionEllingham diagrams are plots of ΔG∘1 Vs T for the formation of
View SolutionDraw the Ellingham diagram for the formation of carbon monoxide. What happens to the stability of carbon monoxide with the increase in temperature ?
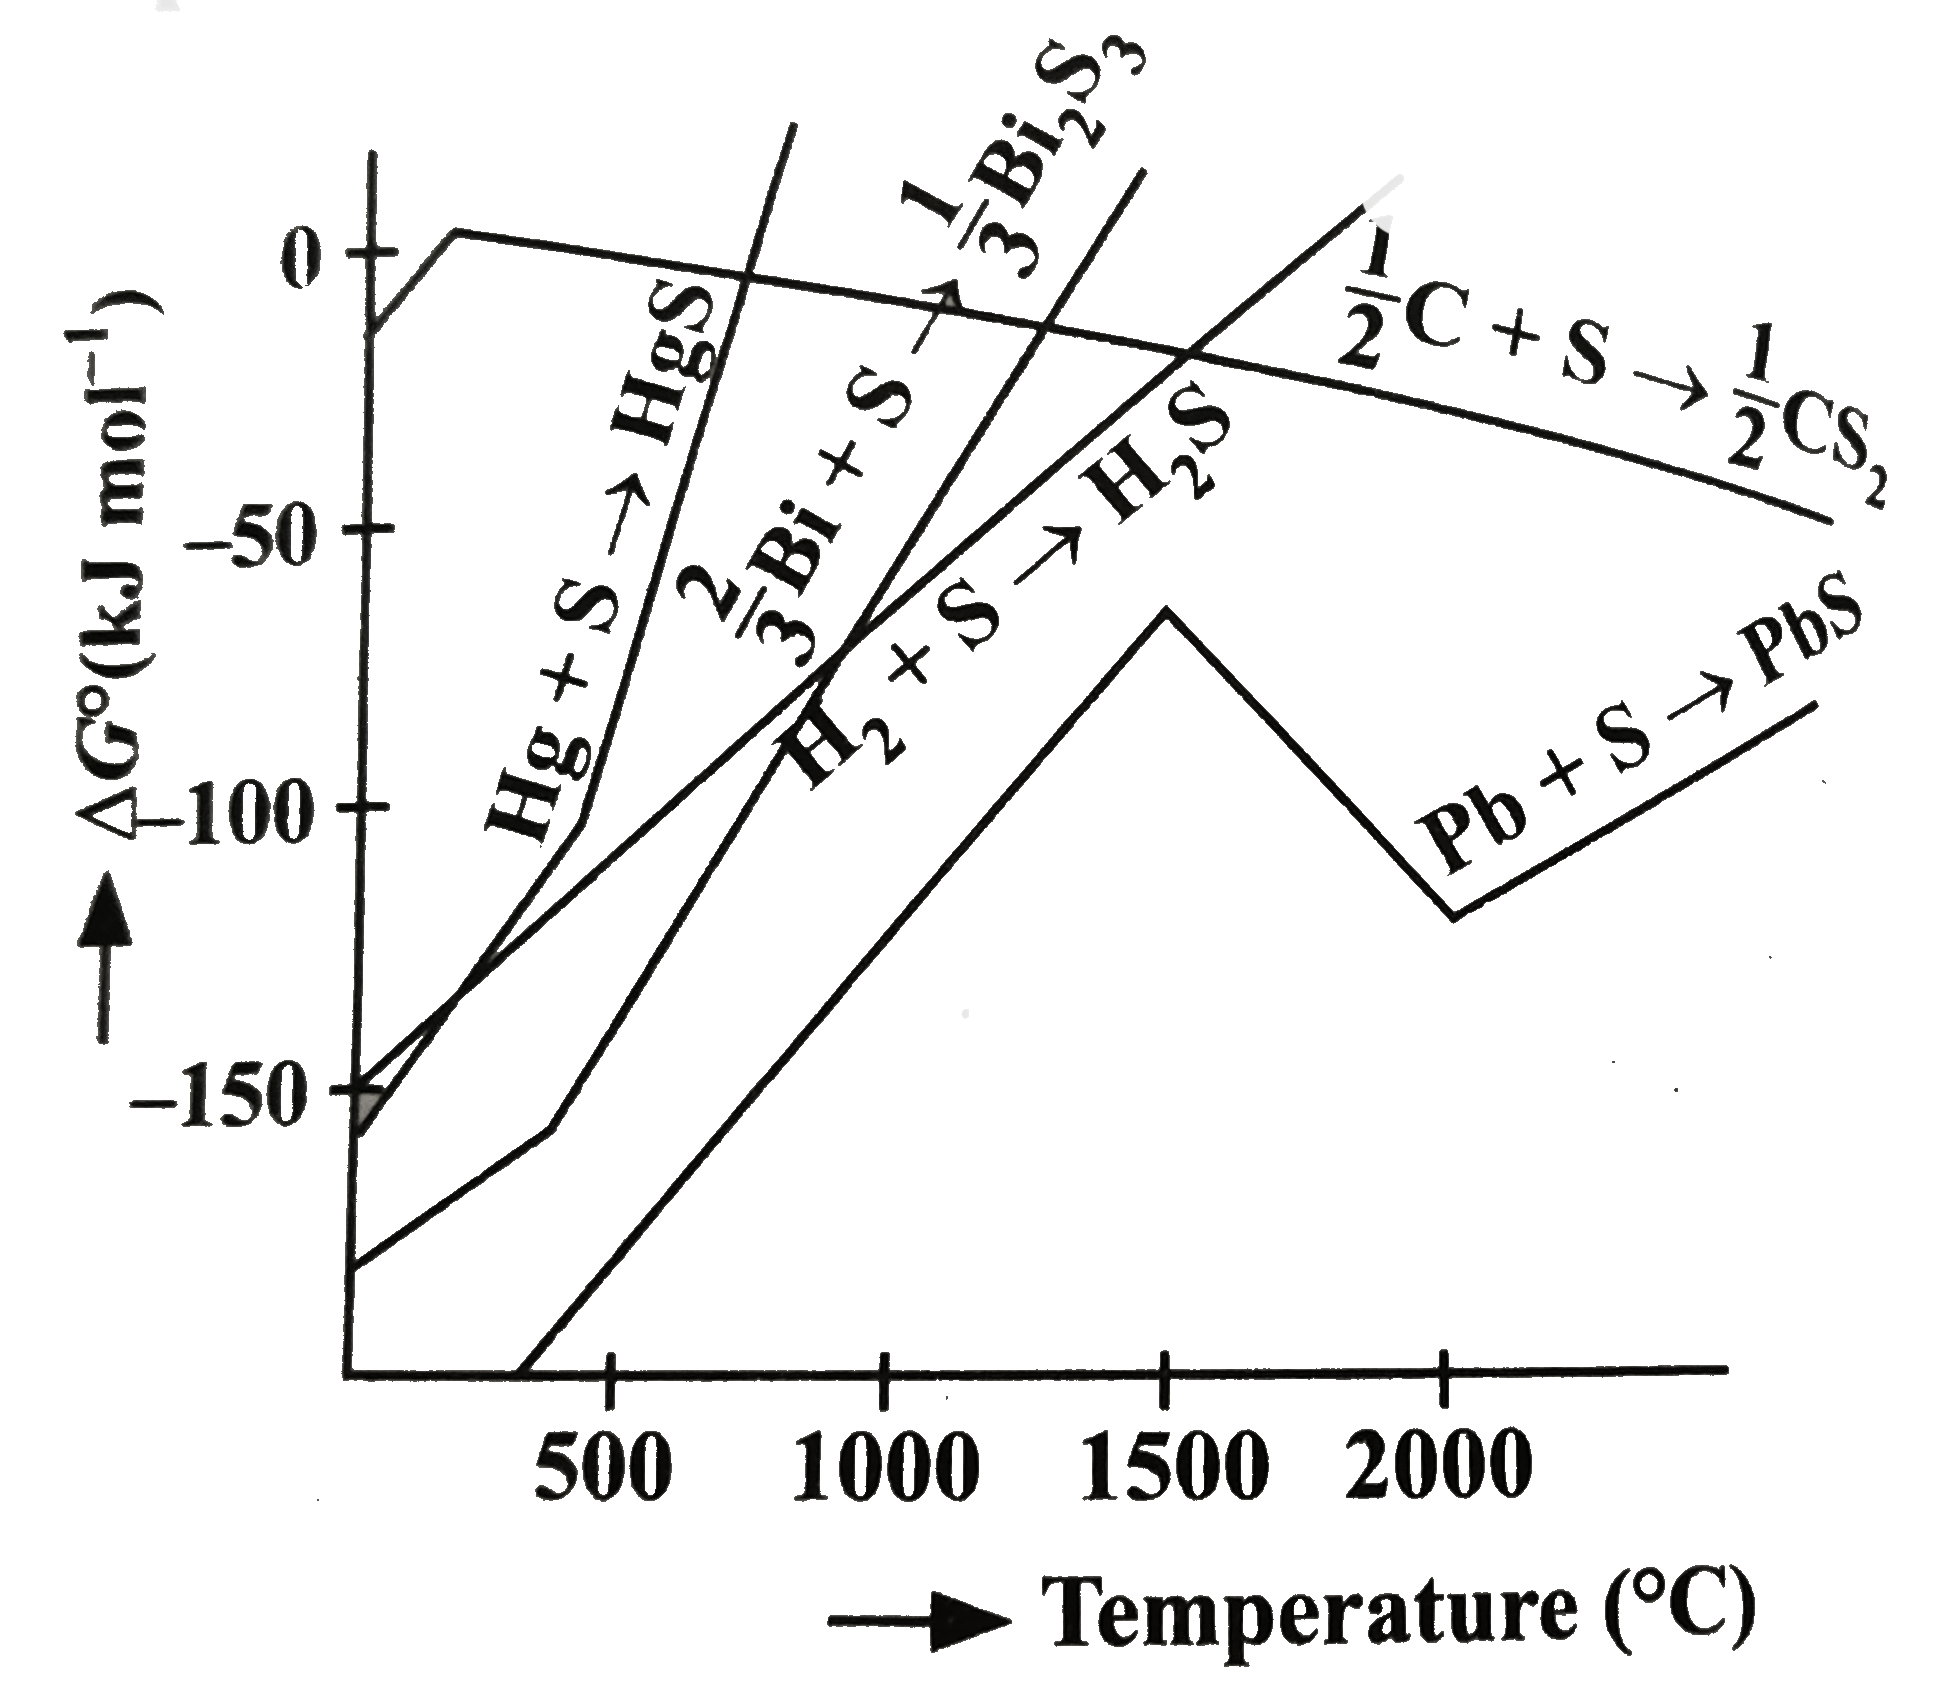
View SolutionThe Ellingham diagram for a number of metallic sulphides is reproduced below.

Answer the questions given below :
(i) Formation of which of the sulphidesis not spontaneous ?
View Solution
