The graph between time period (T) and length (l) of a simple pendulum is
straight line
curve
ellipse
parabola
The correct Answer is:D
The time period of a simple pendulum is,

T=2π√lg
Here, l is the length of the pendulum.
On squaring both sides T2=4π2lg⇒T2∝l
So, the graph between time period T and length l of the pendulum is a parabola.
Similar Questions
Which one of the following graphs indicates the variations of time period (T) of a simple pendulum to with the its length (l) is :
View SolutionThe graph between the time period and the length of a simple pendulum is a:
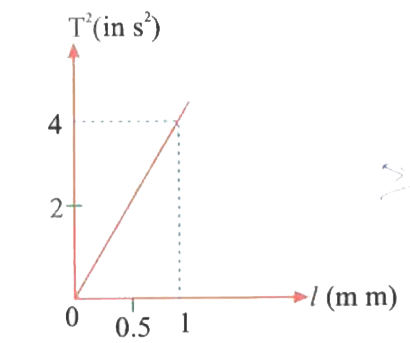
View SolutionThe l−T2 graph of a simple pendulum is an shown in the figure. The time period of the pendulum of length 0.5 mm is

View SolutionIf the time period of a simple pendulum of effective length L is T, then the effective length of a simple pendulum having time period 2T will be
View SolutionFor a simple pendulum the graph between length and time period will be a……………
View SolutionThe graph of time period (T) of simple pendulum versus its length (l) is
View SolutionThe graph of time period (T) of a simple pendulum versus its length (I) is
View SolutionFor a simple pendulum graph between L and T^(2) will be a
View Solution
