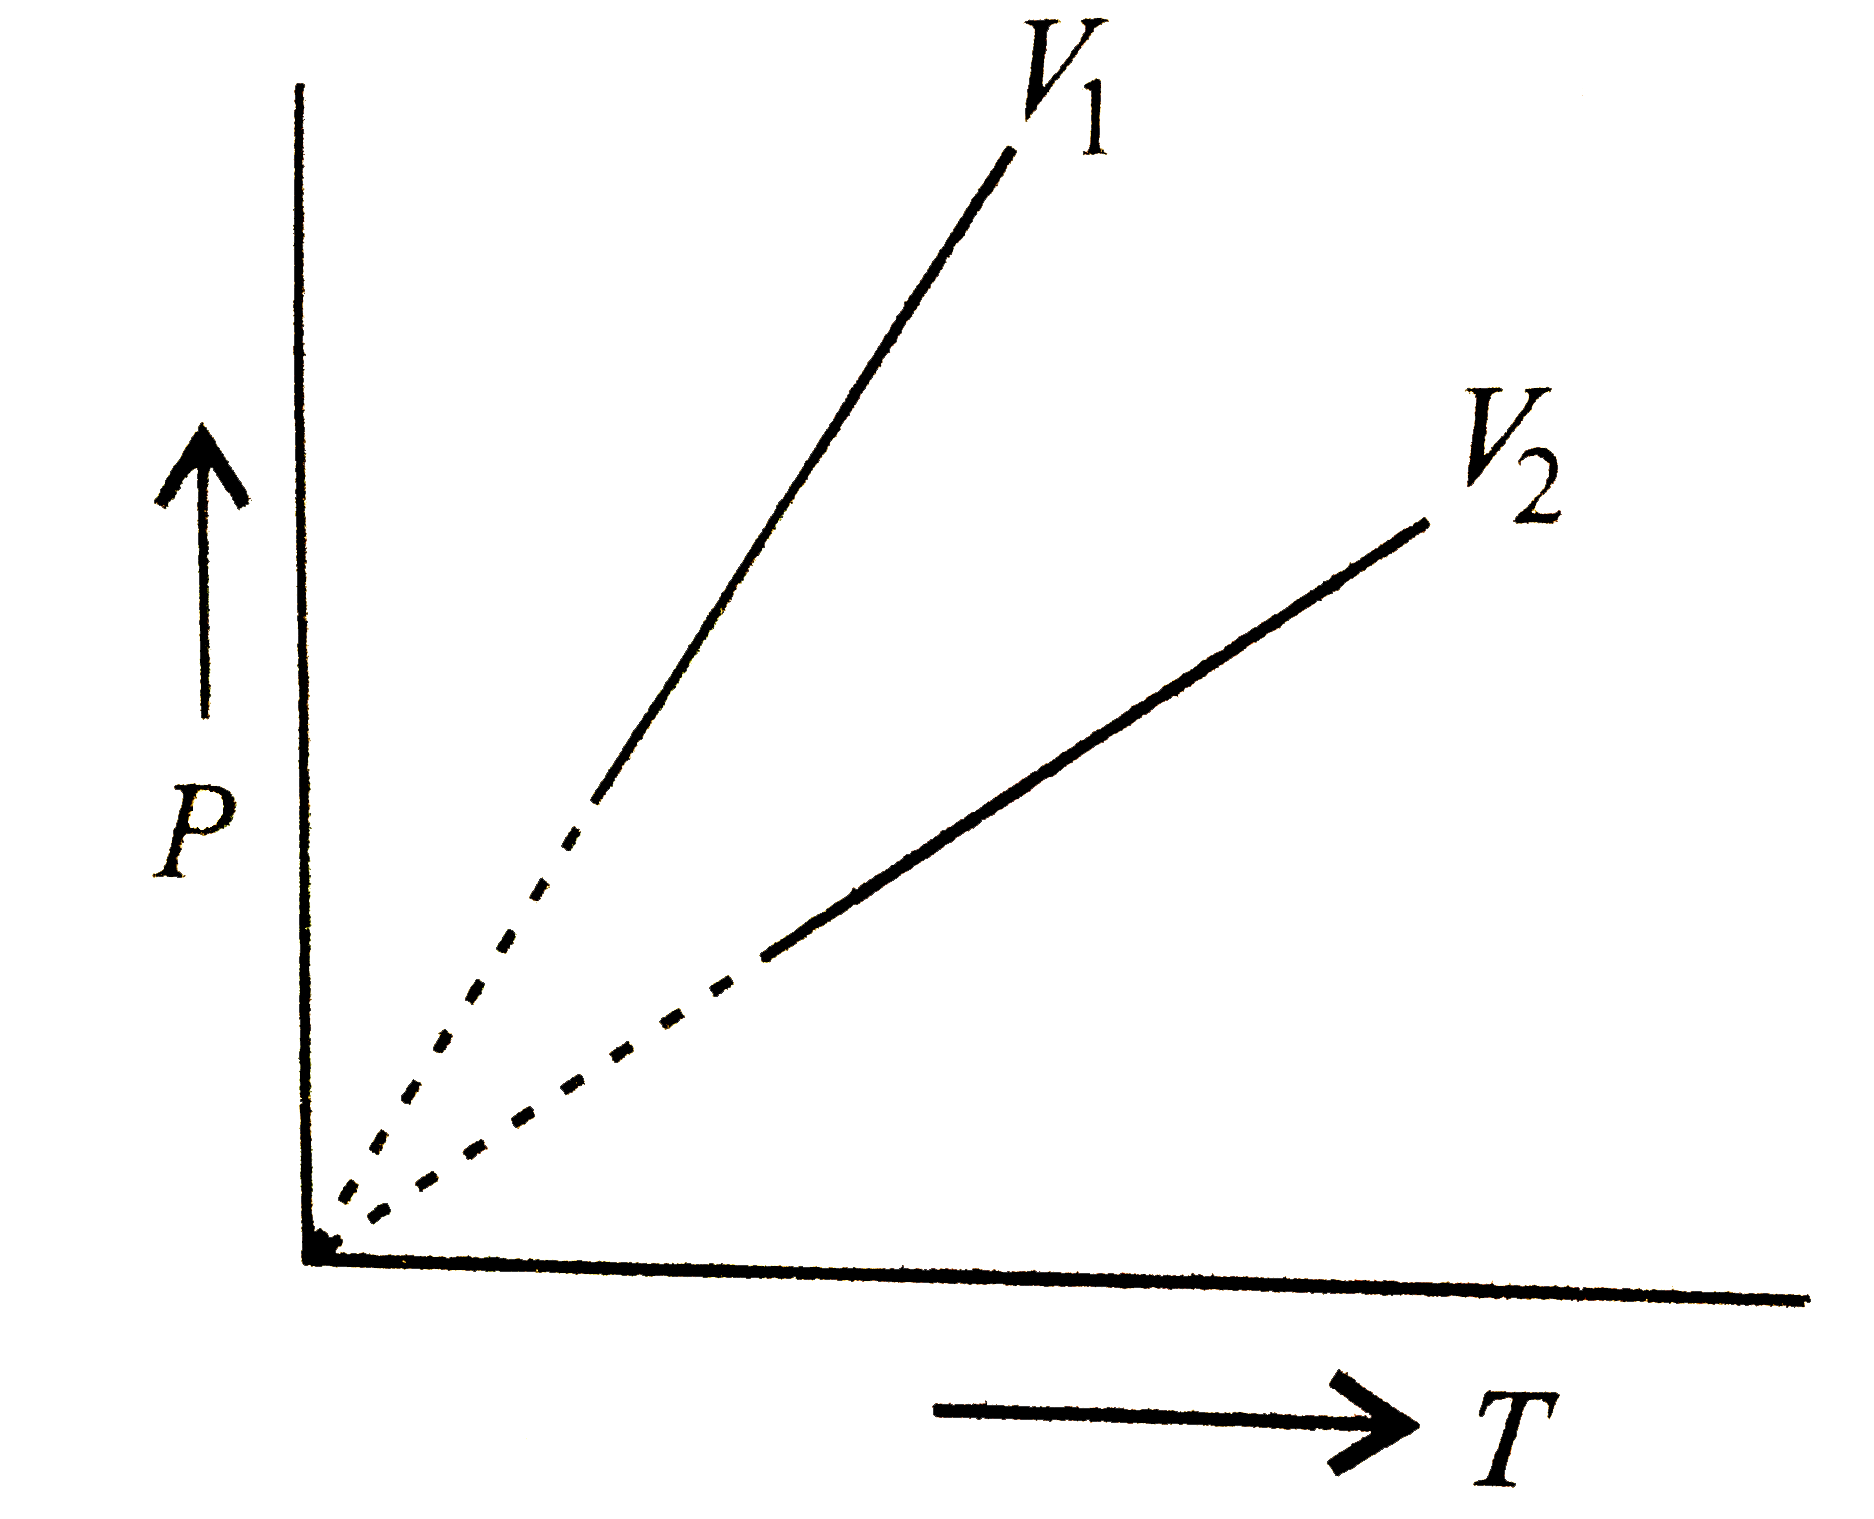
The pressure p for a gas is plotted against its absolute temperature T for two different volumes V1 and V2. If p is plotted on y− axis and T on x−axis, then
The curve for V1 has greater slope than the curve for V2 .
The cureve for V2 has greater slope than the curve for V1
The curves must intersect at some point other than T=0
The curves hace the same slope and do not intersect
Step by step video & image solution for The pressure p for a gas is plotted against its absolute temperature T for two different volumes V_(1) and V_(2). If p is plotted on y- axis and T on x-axis, then by Physics experts to help you in doubts & scoring excellent marks in Class 12 exams.
Updated on:21/07/2023Topper's Solved these Questions
Similar Questions
A small , hollow metal cylinder is closed at one end . Its mass is known . Which of the following instruments are required to find the density of the metal ?
View SolutionSome physical quanties are given in Column I and some possible SI units in which these quantities may be expressed are given in Column II. Match the physical quantities in Column I with the units in Column II.
Column IColumn II(A)GMeMs(p)(volt)(coulomb)(metre)G−universal gravitational constantMe−mass of the earth,Ms−mass of the sun(B)3RTM(q)(kilogram)(metre)3(second)−2R−universal gas constant,T−absolute temperature, M- molar mass(C)F2q2B2(r)(metre)2(second)−2F−force,q−charge,B−magnetic field(D)GMeRe(s)(farad)(volt)2(kg)−1G−universal gravitational constant,Me−mass of the earth,Re−radius of the earth.
View SolutionThe pressure p of a gas is plotted against its absolute temperature T for two different constant volumes, V_(1) and V_(2) when V_(1) gt V_(2) , the
View SolutionThe pressure p for a gas is plotted against its absolute temperature T for two different volumes V_(1) and V_(2) . If p is plotted on y- axis and T on x- axis, then
View SolutionA graph is plotted with PV/T on y-axis and mass of the gas along x-axis for different gases. The graph is
View SolutionThe pressure P of a gas is plotted against its absolute temperature T for two different constant volumes, V_(1) and V_(2) (for same no. of moles) where V_(1) gt V_(2) , the correct statement is:
View SolutionFor fixed amount of ideal gas In P (y-axis) us In B (x-axis) curve is plotted at constant T Select correct statements.
View SolutionThe initial state of certain gas (PiViTi).It undergoes expansion till its volume becomes Vf at constant temperature T. The correct plot of P-V diagram for it is
View SolutionA plot of P vs T for a given mass of gas at constant volume is a straight line . P vs T at constant volumes V1 and V2 for an ideal gas are shown below :
Which of the following is correct ?

View Solution(i) Plotting V vs T for a given mass of an ideal gas at two different fixed pressures P_(1) and P_(2) gives two straight lines, one of which corresponds to P_(1) and the other corresponds to P_(2) . If P_(1) is greater than P_(2) , then which one of thes straight lines will make a larger angle with the T-axis? (ii) Plotting P vs T for a given mass of an ideal gas at two different fixed volumes V_(1) and V_(2) gives two straight lines, one of which corresponds to V_(1) and the other corresponds to V_(2) . if V_(1) is greater than V_(2) , then which one of these straight lines will make a larger angle with the T-axis?
View SolutionWhich one of the following the graph between "log" p (on Y-axis) and 1/T (on X-axis)? (p=vapour pressure of a liquid,T=Absolute temprature)
View SolutionA gas is undergoing an adiabatic process. At a certain stage, the volume and absolute temperature of the gas are V_(0), T_(0) and the magnitude of the slope of the V-T curve is m. molar specific heat of the gas at constant pressure is [Assume the volume of the gas is taken on the y-axis and absolute temperature of the gas taken on x-axis]
View SolutionFor 1 mol ofan ideal gas at a constant temperature T, the plot of (log P) against (log V) is a (P: Pressure, V: Volume)
View SolutionThe initial state of certain gas (P_(i)V_(i)T_(i)) .It undergoes expansion till its volume becomes V_(f) at constant temperature T. The correct plot of P-V diagram for it is
View SolutionA plot of P vs T for a given mass of gas at constant volume is a straight line . P vs T at constant volumes V_(1) and V_(2) for an ideal gas are shown below : Which of the following is correct ?
View SolutionThe pressure P for a gas is plotted against its absolute temperature T for two different volumes V_1 and V_2 where V_1 gt V_2 . If P is plotted on y-axis and T on x-axis, then:
View Solution

