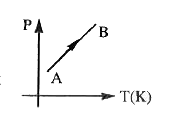
The P-T graph, as given below, was observed for a process on an ideal gas. Which of the statement is true ?
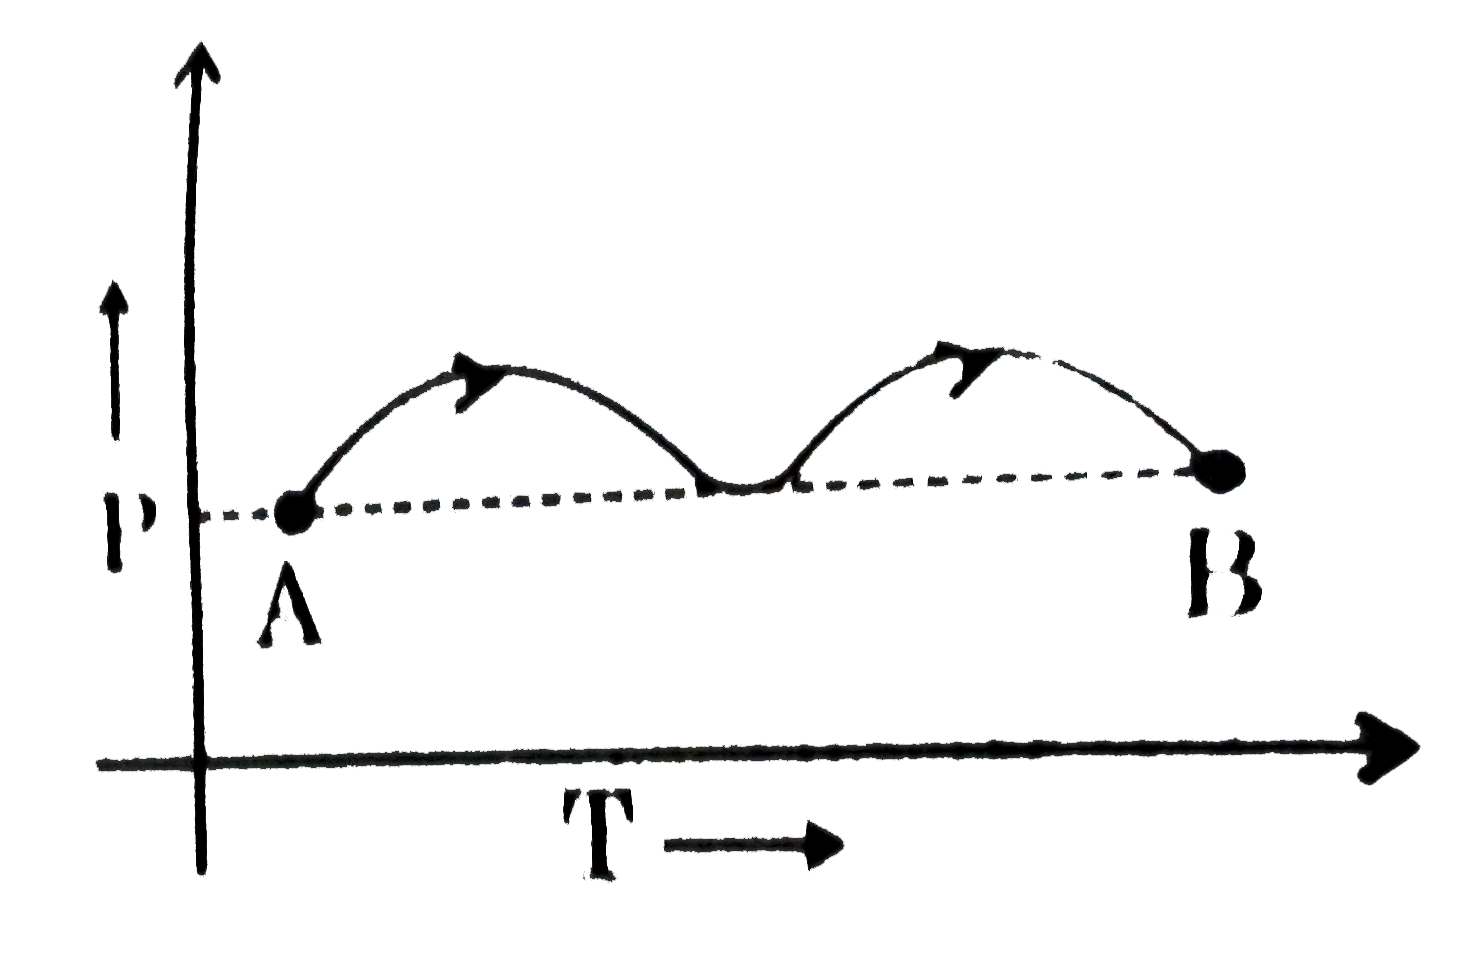
w=+ve,ΔH=+ve
w=−ve,ΔH=−ve
w=−ve,ΔH=+ve
w=+ve,ΔH=−ve
The correct Answer is:C
Step by step video & image solution for The P-T graph, as given below, was observed for a process on an ideal gas. Which of the statement is true ? by Chemistry experts to help you in doubts & scoring excellent marks in Class 12 exams.
Updated on:21/07/2023Similar Questions
Straight line on (p - T) graph for an ideal gas represents isochoric process.
If p∝T,V=constant.
View SolutionThe P-T graph for the given mass of an ideal gas is shown in figure. Then the volume
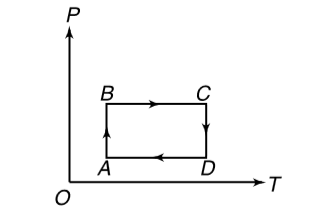
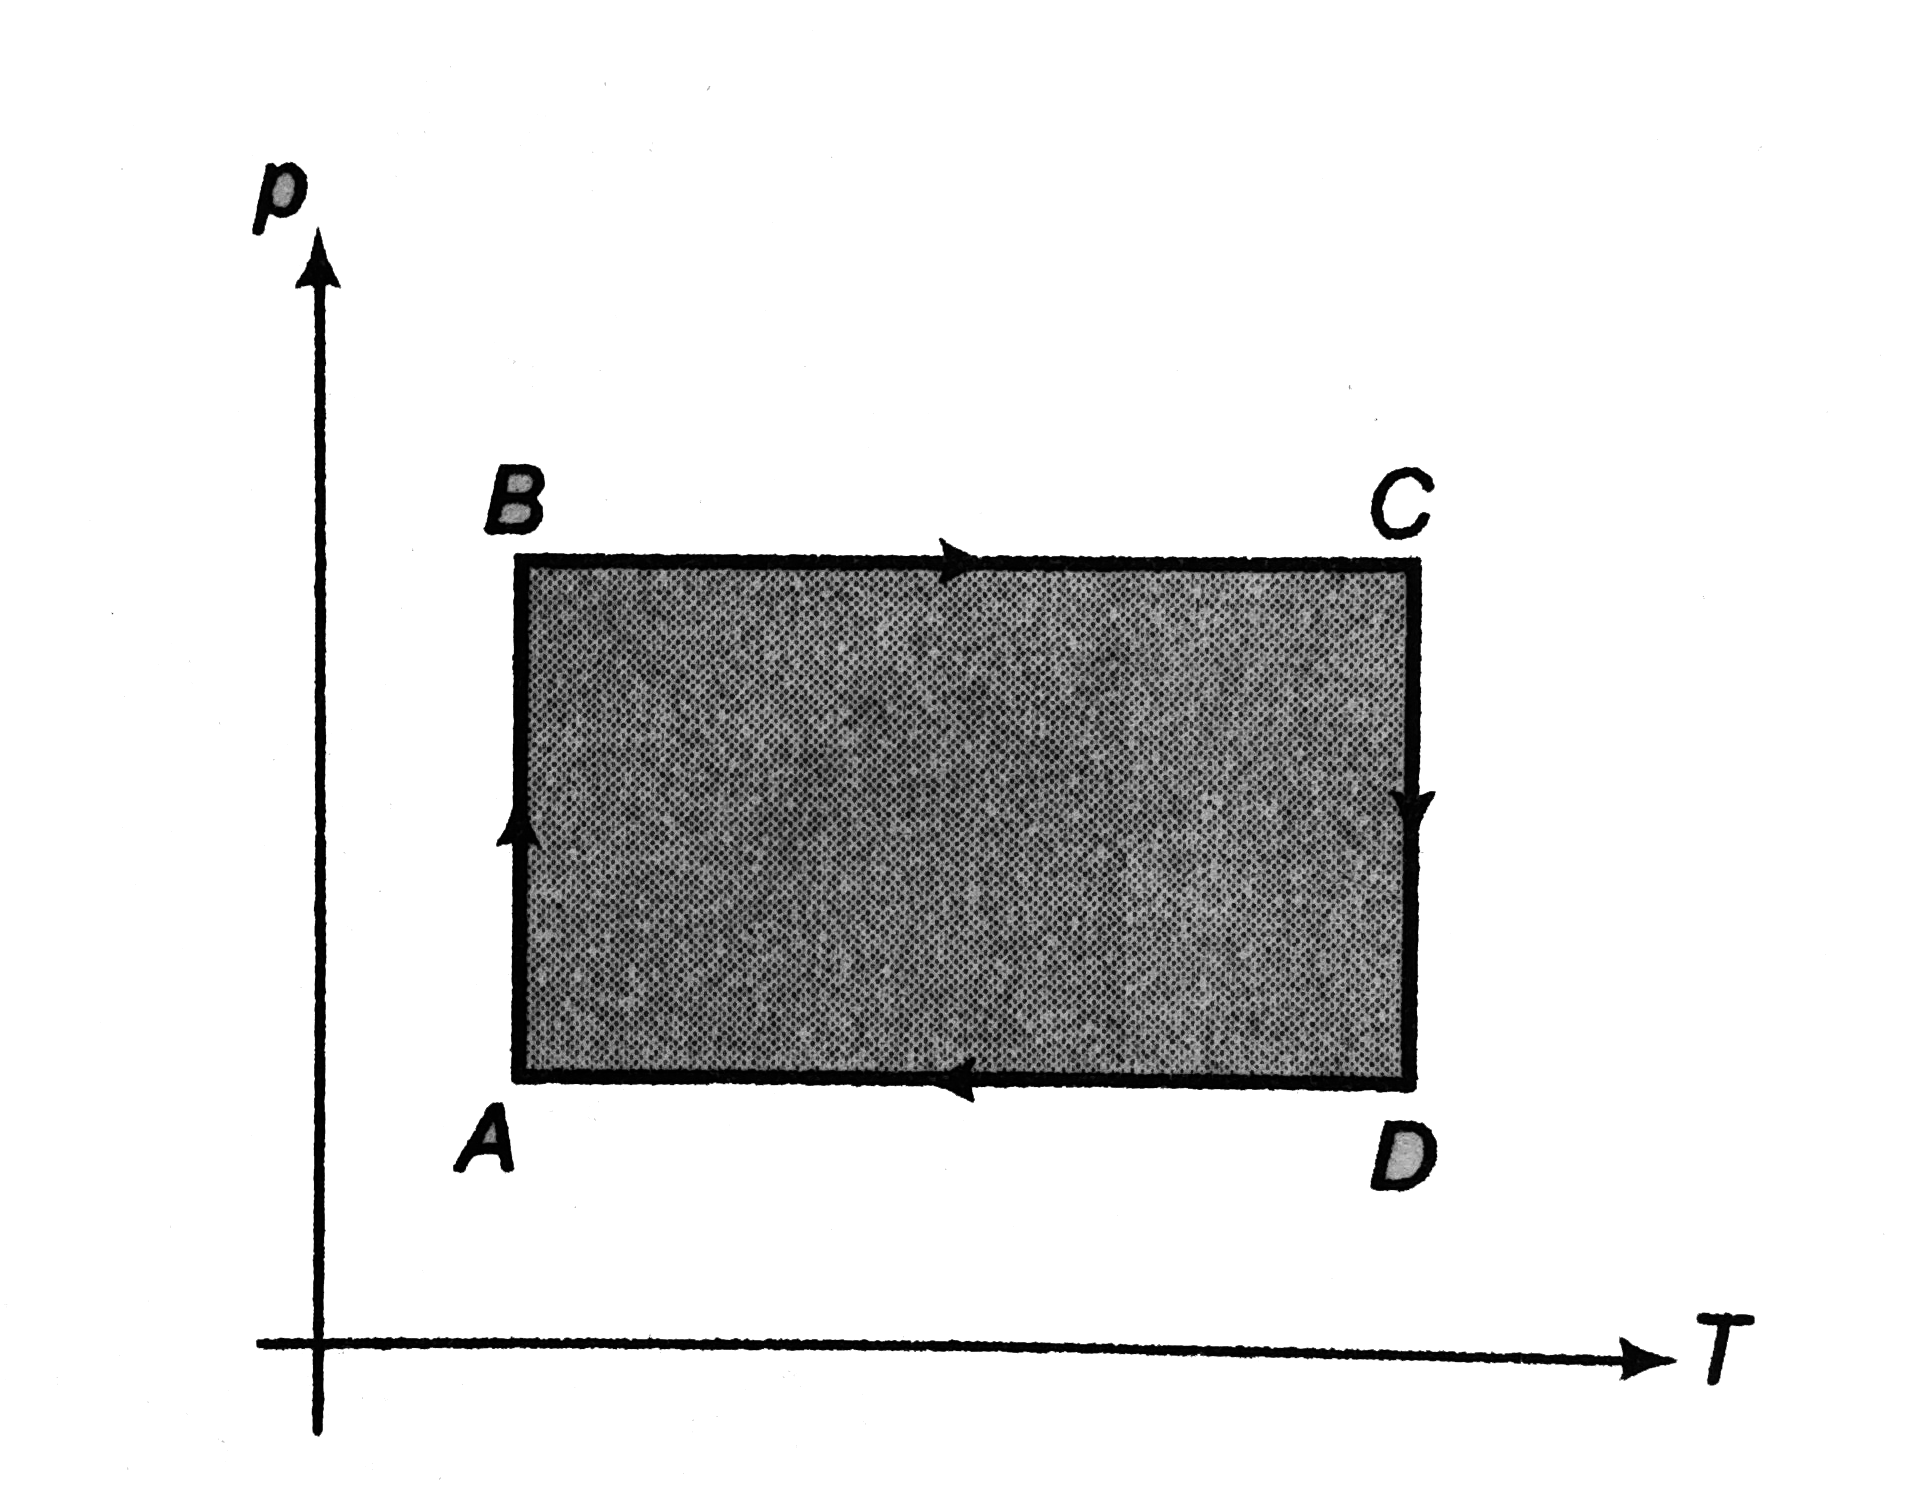
View SolutionAn ideal gas undergoes a cyclic process A→B→C→D for which P – T graph is as shown. Draw P – V and V – T of graph to represent the same process.
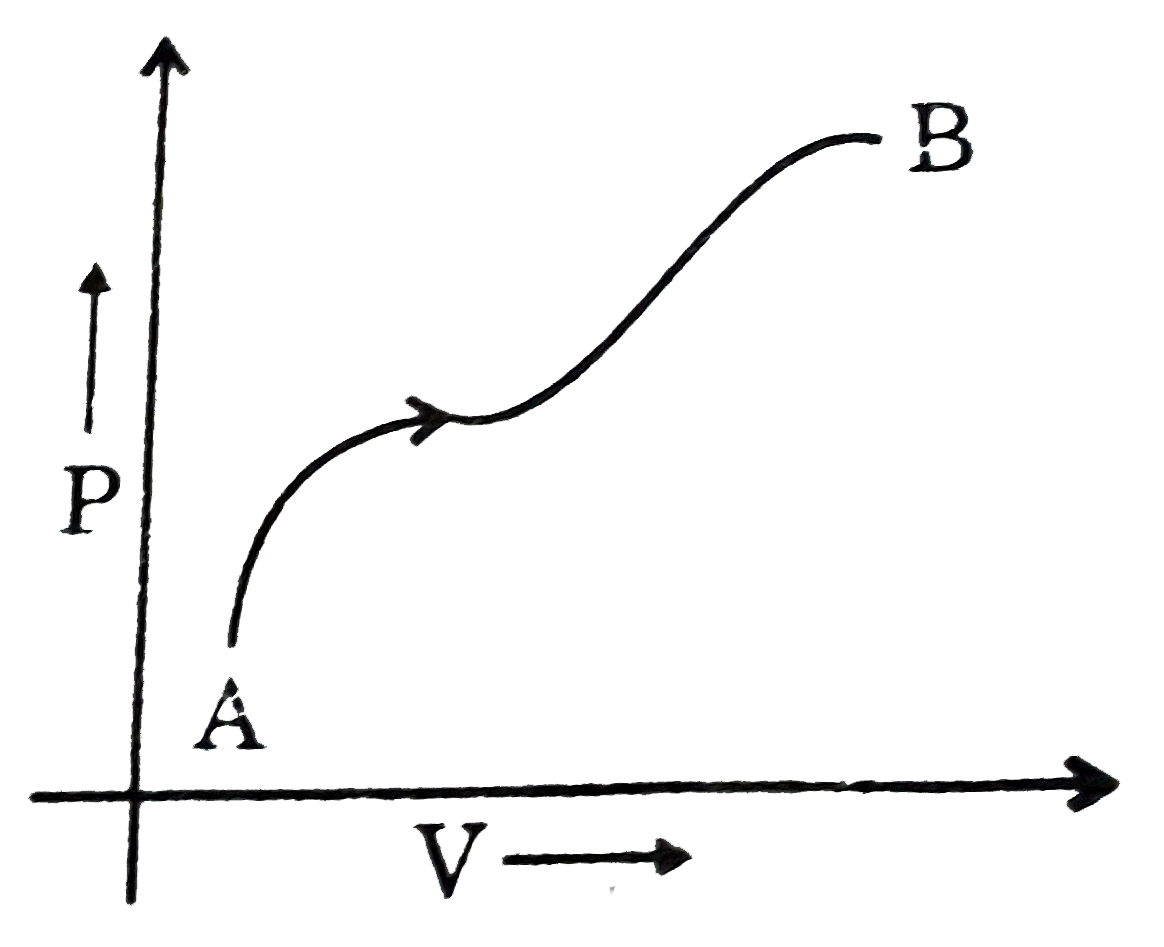
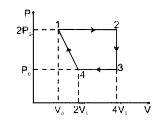
View SolutionThe graph given below shows the P-V plot for a process on an ideal gas. Select the correct statement.
View SolutionThe P-T graph, as given below, was observed for a process on an ideal gas. Which of the statement is true ?

View SolutionThe P-T graph, as given below, was observed for a process on an ideal gas. Which of the statement is true ?

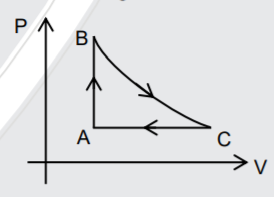
View SolutionFor the given P-V graph for an ideal gas, chose the correct V-T graph. Process BC is adiabatic.
View SolutionStraight line on (p - T) graph for an ideal gas represents isochoric process.
If p∝T,V=constant.
View SolutionOne mole of a monatomic ideal gas undergoes a cyclic process as shown in the figure (where V is the volume and T is the temperature). Which of the statements below is (are) true ?
View SolutionOne mole of a monatomic ideal gas undergoes a cyclic process as shown in the figure (where V is the volume and T is the temperature). Which of the statements below is (are) true?
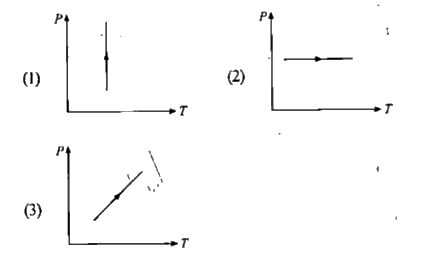
View SolutionP-T graphs of an ideal gas are as shown in figures-2.42 below. Choose the wrong statement from the options given:
View SolutionFor the given P-V graph for an ideal gas, chose the correct V-T graph. Process BC is adiabatic.
View SolutionPlot P-V, V-T and p-T graph correspongidng to the P-T graph for an ideal gas shown in figure.
View SolutionThe P-T graph for the given mass of an ideal gas is shown in figure. Then the volume
View Solutionएक आदर्श गैस के दिए गए प्रक्रम के लिए निम्न में से कौन सा कथन सत्य है :
View SolutionPlot (p - V),(V - T) and (ρ - T) graph corresponding to the (p - T) graph for an ideal gas shown in figure.
 .
.
View Solution
