Which of the following P-V curve best represents. As isothermal process?


The correct Answer is:C
Step by step video solution for Which of the following P-V curve best represents. As isothermal process? by Physics experts to help you in doubts & scoring excellent marks in Class 12 exams.
Updated on:21/07/2023Topper's Solved these Questions
- THERMODYNAMICSBOOK - AAKASH INSTITUTE ENGLISHCHAPTER - THERMODYNAMICSEXERCISE - ASSIGNMENT (SECTION -A) (Objective Type Questions)
47 Videos
- THERMODYNAMICSBOOK - AAKASH INSTITUTE ENGLISHCHAPTER - THERMODYNAMICSEXERCISE - ASSIGNMENT (SECTION -B) (Objective Type Questions)
30 Videos
- THERMODYNAMICSBOOK - AAKASH INSTITUTE ENGLISHCHAPTER - THERMODYNAMICSEXERCISE - TRY YOURSELF
12 Videos
- THERMAL PROPERTIES OF MATTERBOOK - AAKASH INSTITUTE ENGLISHCHAPTER - THERMAL PROPERTIES OF MATTEREXERCISE - Assignment (Section-J) Akash Challengers Questions
7 Videos
- UNITS AND MEASUREMENTSBOOK - AAKASH INSTITUTE ENGLISHCHAPTER - UNITS AND MEASUREMENTSEXERCISE - ASSIGNMENT (SECTION - D)
15 Videos
Similar Questions
If W si work done by the system (−ve), the mathematical respresentation of the first law of thermodynamics is//are
View SolutionA container is filled with 20 moles of an ideal diatomic gas at absolute temperature T. When heat is supplied to gas temperature remains constant but 8 moles dissociate into atoms. Heat energy given to gas is
View SolutionWhat is the essential condition for thermodynamic equilibrium?
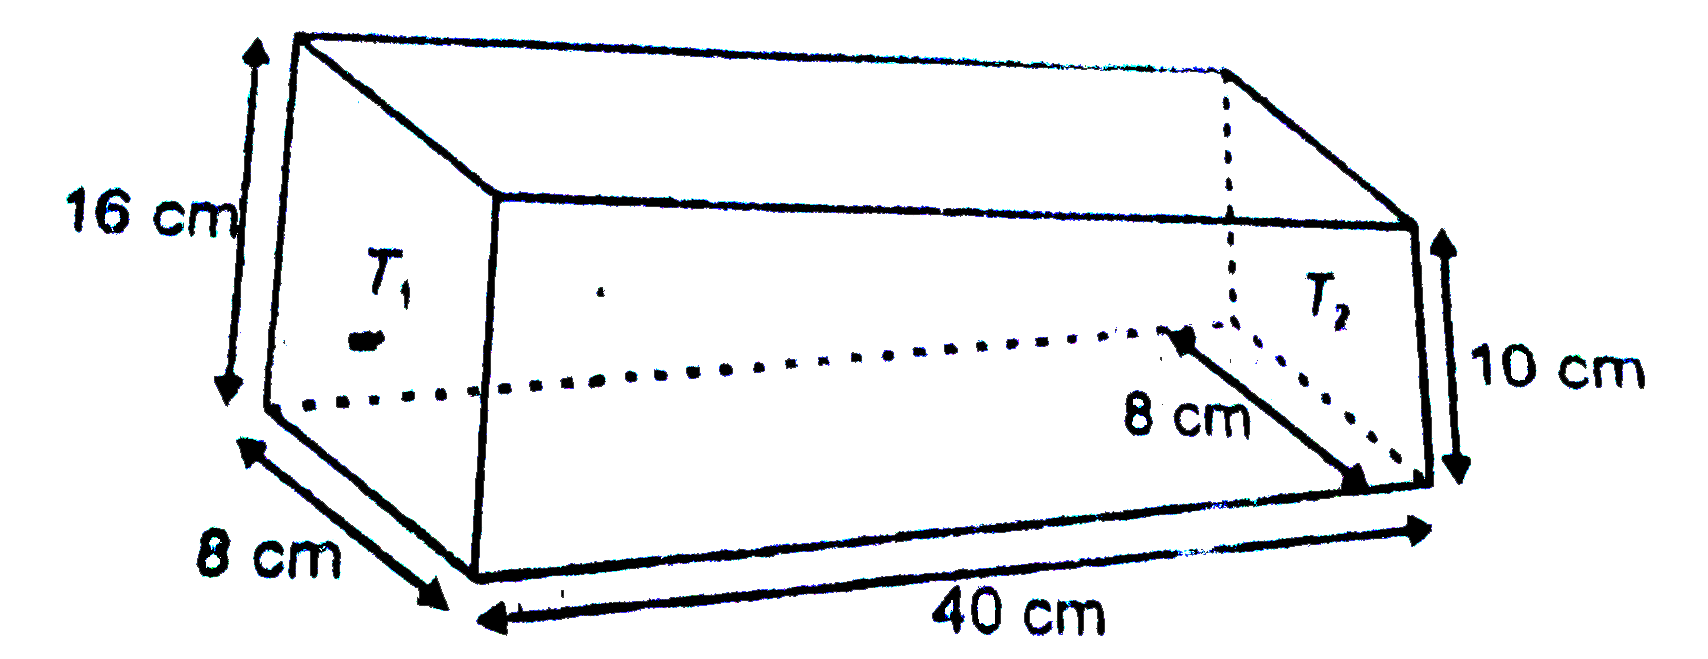
View SolutionA slab of cunductivity k is in the shape of trapezoid as shown I figure. If the two end faces be maintained at temperature T1=50∘CandT2=25∘C, then determine the thermal current through the slab by ignoring any heat loss through the lateral surfaces.
 .
.
View SolutionA : PARSEC and light year, both measure time
R : Both have dimension of time.
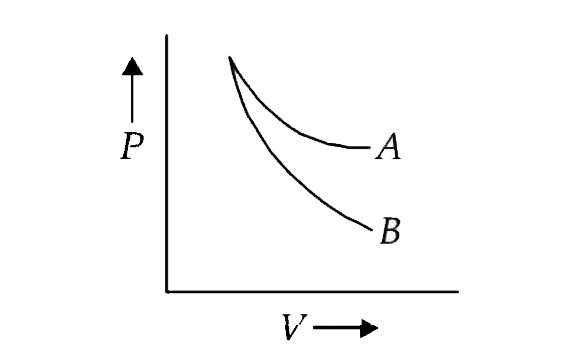
View SolutionThe curves A and B in the figure shown P-V graphs for an isothermal and an adiabatic process for an idea gas. The isothermal process is represented by the curve A.
View SolutionA cyclic process ABCD is shown is shown in the following P-V diagram. Which of the following curves represent the same process ?
View SolutionWhich of the following P−V diagrams best represents an isothermal process?
View SolutionA cyclic process ABCD is shown in the figure P - V diagram. Which of the following curves represent the same process
View SolutionWhich of the following P-V curve best represents. As isothermal process?
View SolutionWhich of the following P-V curve best represents. As isothermal process?
View SolutionDraw P-V curves for isothermal and adiabatic processes of an ideal gas.
View SolutionWhy is p-V curve for adiabatic process steeper than that for isothermal process?
View SolutionThe slope of adiabatic P-V curve is_____times the slope of isothermal P-V curve in the process.
View SolutionThe curves A and B in the figure shown P-V graphs for an isothermal and an adiabatic process for an idea gas. The isothermal process is represented by the curve A.

View SolutionWhich of the following P-V curve best represents. As isothermal process?
View Solution

