The table below shows the admission and transfer in standards 1-3 of a school.

In the given table, in Standard 1, how many students were there at the end of year 2016?
223
228
236
232
Step by step video solution for The table below shows the admission and transfer in standards 1-3 of a school. In the given table, in Standard 1, how many students were there at the end of year 2016? by Maths experts to help you in doubts & scoring excellent marks in Class 14 exams.
Updated on:21/07/2023Topper's Solved these Questions
Similar Questions
The table below shows the admission and transfer in standars 1-3 of a school

IN the given table in standard 1 how many students were there at the end of year 2016
View SolutionThe table below shows the admissions and transfers in standards 1-3 of a school.

In the given table, what was the total strength in Standards 1-3 at the end of 2015?
View SolutionThe table below shows the admission and transfer in standards 1-3 of a school.

In the given table, what was the difference between admission and transfer in standard 3 in year 2016?
View SolutionThe table below shows the admission and transfer in standars 1-3 of a school

IN the given table what was the difference between admission and transfer in standard 3 in year 2016
View SolutionThe table below shows the admission and transfer in standards 1-3 of a school.

In the given table, in Standard 1, how many students were there at the end of year 2016?
View SolutionThe table below shows the admission and transfer in standards 1-3 of a school.
निम्नलिखित तालिका किसी विद्यालय की कक्षा 1-3 में नामांकन एवं स्थानांतरण को दर्शाती है | In the given table, what was the difference between admission and transfer in standard 3 in year 2016?
दी गयी तालिका के अनुसार, वर्ष 2016 में कक्षा 3 में नामांकन तथा स्थानांतरण में क्या अंतर था ?
View SolutionThe table below shows the admission and transfer in standards 1-3 of a school.
निम्नलिखित तालिका किसी विद्यालय की कक्षा 1-3 में नामांकन एवं स्थानांतरण को दर्शाती है | In the given table, what was the total strength in Standards 1-3 at the end of 2015?
दी गयी तालिका के अनुसार, 2015 के अंत में कक्षा 1-3 की कुल क्षमता क्या थी?
View SolutionThe table given below shows the months of birth of 40 students of a class in a school .

If one student is chosen at random , what is the probability that the student is born
(i) in the latter half of the year ?
(ii) in a month having 31 days ?
(iii) in a month having 30 days ?
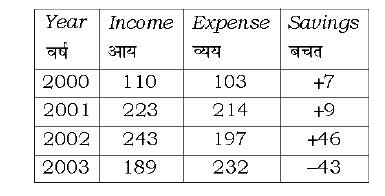
View SolutionThe table shows income and expenditure of a person for 3 years

In the given table, what is the percentage of expenditure on income in the year 2002
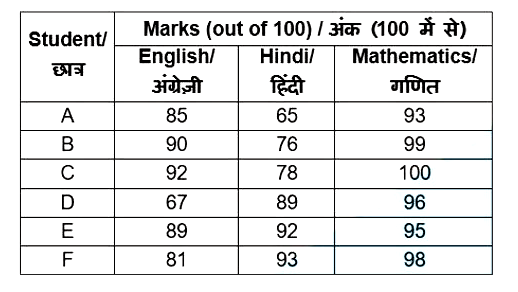
View SolutionThe table given below shows the marks obtained by 6 students in 3 subjects.

In which subject the total marks obtained by the given six students are highest?
View Solution