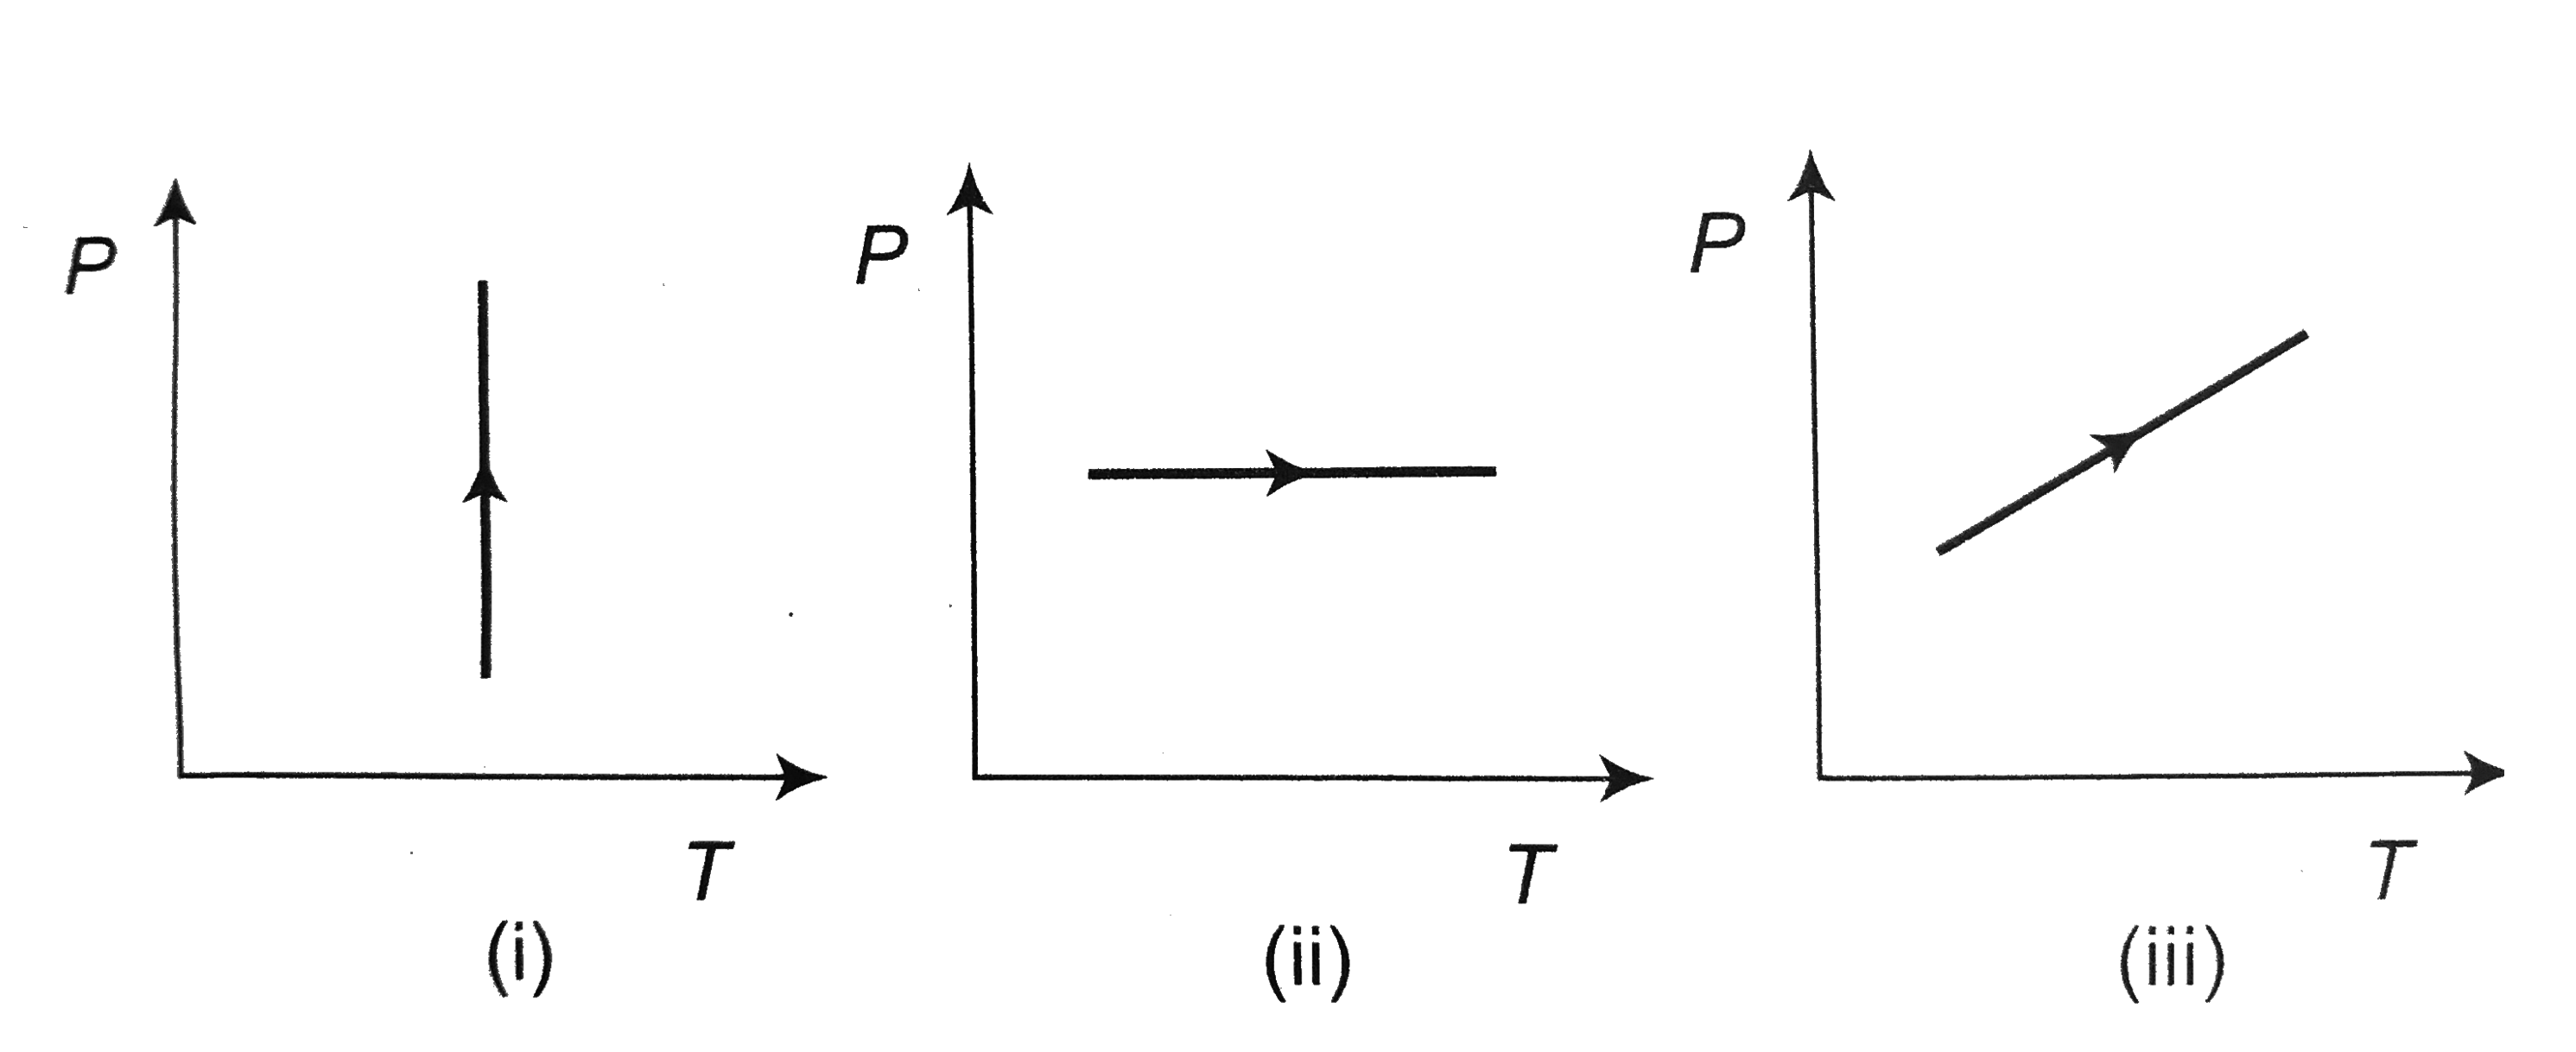
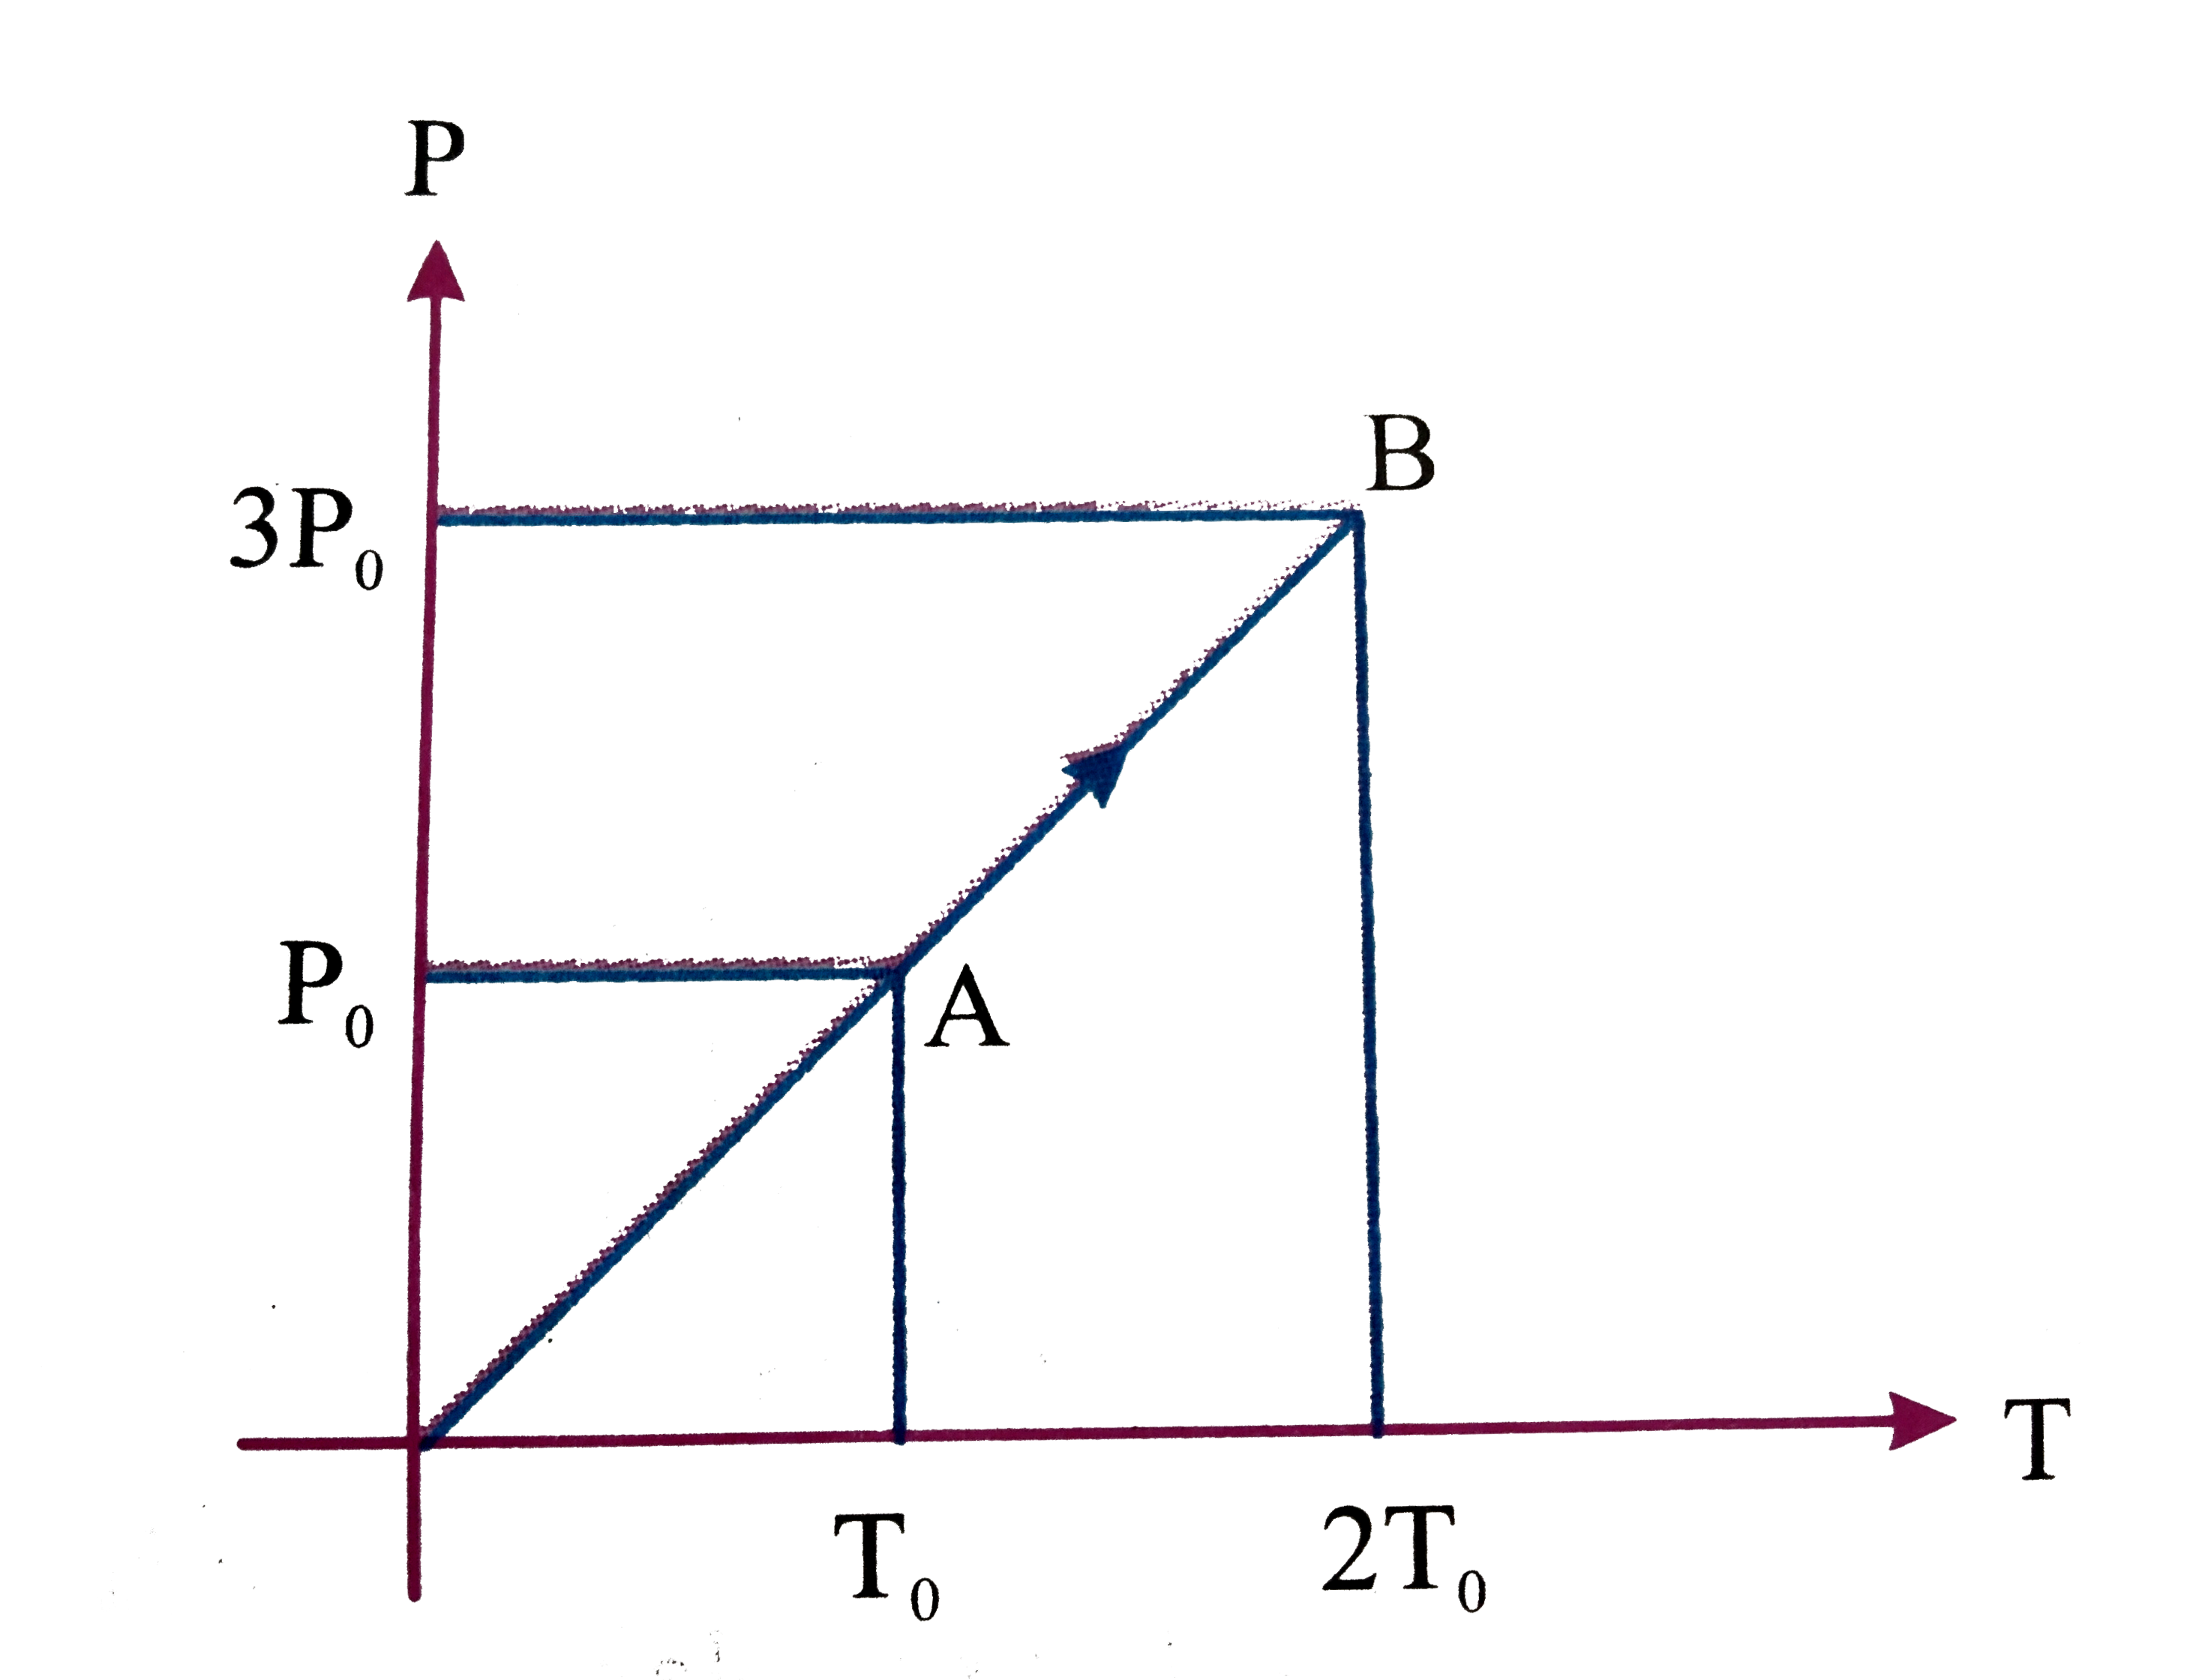
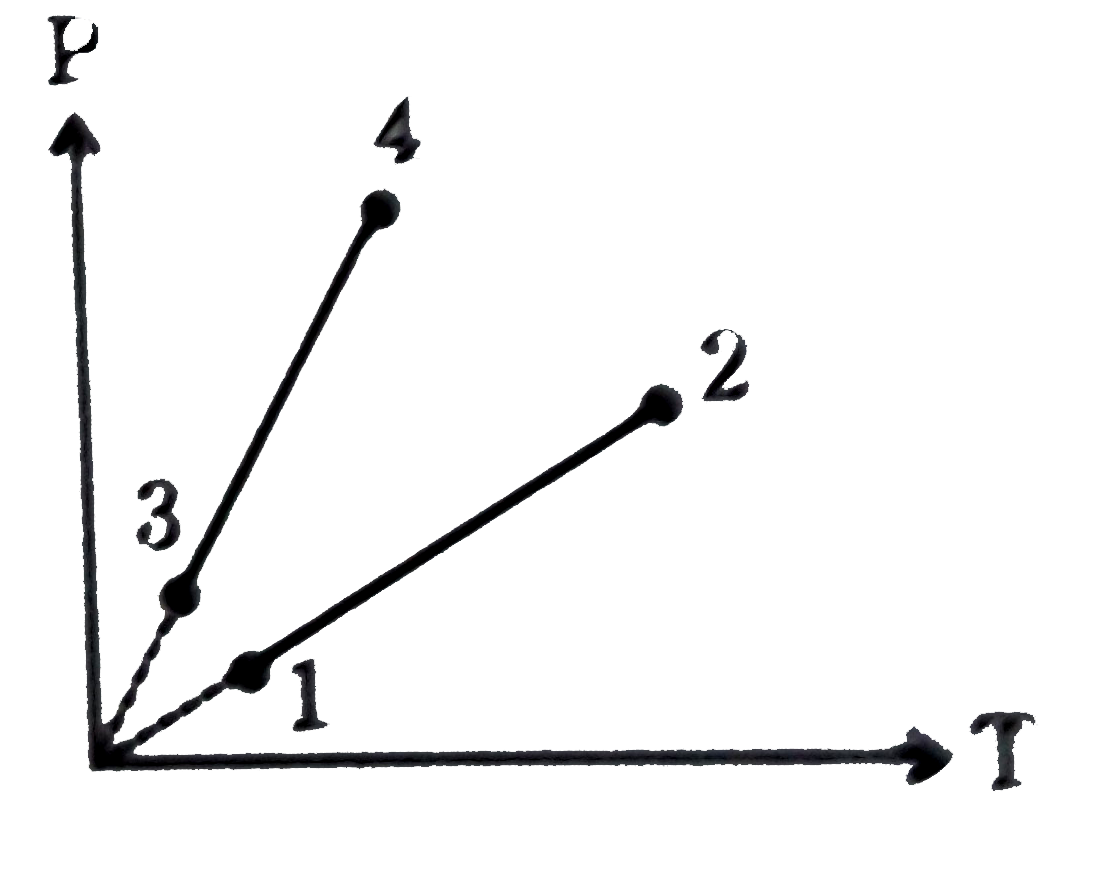
Pressure versus temperature graphs of an ideal gas are as shown in figure. Choose the wrong statement
 Solution in Gujrati
Density of gas is incresing in graph (i)
Density of gas decreasing in graph (ii)
Density of gas isconstant in graph (iii)
None of the above
The correct Answer is:D
For equation : (∵p=ρRTMw)
At constant temperature ρ∝P
1st graph : ρ∝P At constant temperature
For 2nd graph : (∵P=ρRTMw)
At constant P , ρ∝1t
For 3rd graph L:dPdT = constant ⇒P∝T
⇒ density ρ = constant
_E01_043_S01.png)
Topper's Solved these Questions
- GEOMETRICAL OPTICSBook:ALLEN Chapter:GEOMETRICAL OPTICSExercise:EXERCISE -02
Explore 82 Videos
- GEOMETRICAL OPTICSBook:ALLEN Chapter:GEOMETRICAL OPTICSExercise:EXERCISE -03
Explore 11 Videos
- GEOMETRICAL OPTICSBook:ALLEN Chapter:GEOMETRICAL OPTICSExercise:SOME WORKED OUT EXAMPLES
Explore 83 Videos
- CURRENT ELECTRICITYBook:ALLEN Chapter:CURRENT ELECTRICITYExercise:EX.II
Explore 66 Videos
- GRAVITATIONBook:ALLEN Chapter:GRAVITATIONExercise:EXERCISE 4
Explore 9 Videos
Similar Questions
A triangular plate has two cavities , one square and one rectangular as shown in figure . The plate is heated.
_E01_066_Q01.png)
View SolutionThree liquids A,B and C having same specific heat and mass m , 2m and 3 m have temperature 20∘C,40∘C and 60∘C respectively. Temperature of the mixture when:
Column-IColumn-II(A)A and B are mixed(p)33∘C(B)A and C are mixed(q)52∘C(C)B and C are mixed(r)50∘C(D)A,B and C all three are mixed(s)46∘C(t)None
View SolutionIn an 20 m deep lake, the bottom is at a constant temperature of 4∘C. The air temperature is constant at −10∘C. The thermal conductivity of ice in 4 times that water. Neglecting the expansion of water on freezing, the maximum thickness of ice will be
View SolutionIn the Bohr's model of hy drogen atom, the electron moves around the nucleus in a circular orbit of radius 5×10⁻¹¹m. Its time period is 1.5×10⁻¹⁶s. The current associated with the electron motion is:-
View SolutionAssertion : The difference in the value of acceleration due to gravity at pole and equator is proportional to square of angular velocity of earth.
Reason : the value of acceleration due to gravity is minimum at the equator and maximum at the pole.
View SolutionPressure versus temperature graph of an ideal gas as shown in Fig. Corresponding density (rho) versus volume (V) graph will be
View SolutionPressure versus temperature graphs of an ideal gas are as shown in figure. Choose the wrong statement

View SolutionPressure versus temperature graph of an ideal gas is shown in figure. Density of the gas at point A is P0. Density at B will be

View SolutionPressure versus temperature graph of an ideal gas of equal number of moles of different volumes is plotted as shown in figure. Choose the correct alternatives.

View SolutionPressure versus density graph of an ideal gas is shown in figure
View SolutionPressure versus temperature graph of an ideal gas are as shown in figure-2.39. Choose the wrong statement
View SolutionPressure versus temperature graph of an ideal gas is as shown in figure. Density of the gas at point A is ρ0 . Density at point B will be ____

View SolutionPressure versus temperature graph of an ideal gas is as shown in figure. Density of the gas at point A is rho_0 . Density at B will be:
View SolutionPressure versus temperature graphs of an ideal gas are as shown in figure. Choose the wrong statement

View SolutionPressure versus temperature graph of an ideal gas at constant volume V is shown by the straight line A. Now mass of the gas is doubled and the volume is halved, then the corresponding pressure versus temperature graph will be shown by the line
View SolutionPressure versus density graph of an ideal gas is shown in figure
View Solution
