Study the graph and answer the following questions-
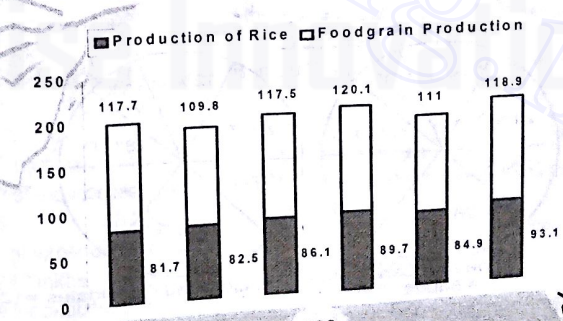
What is the maximum percentage of decrease in other food grain production with respect to previous years?
6.25%
6.44%
6.63%
6.86%
The correct Answer is:C
Topper's Solved these Questions
Similar Questions
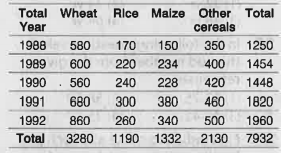
Direction :- The following table shows the production of food grains (in million tonnes) in a state for the period 1988 to 1992. Read the table and answer the following questions.
During 1990, the percentage of decrease in production of maize as against the previous year was
View SolutionDirection : Study the following bar diagram carefully and answer the four questions.
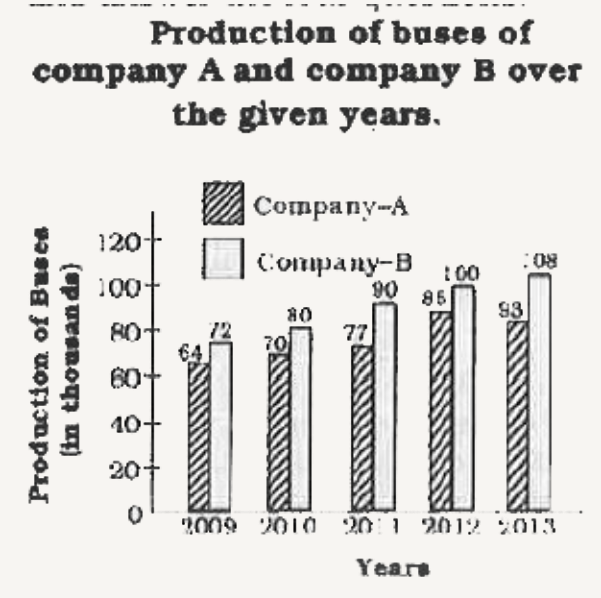
In which year for the company A the percentage increase of production of buses with respect to the previous year is maximum?
View Solution
Knowledge Check
Study the graph and answer the following questions-
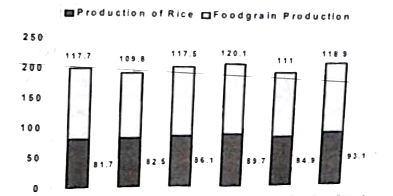
Over the given years what is average production of rice?A86.33 million tonnesB88.66 million tonnesC85 million tonnesD88 million tonnesStudy the following graph and answer the questions.
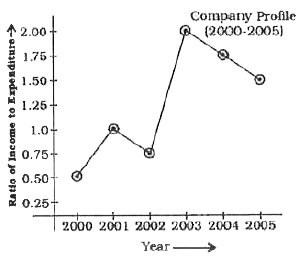
Find the percentage decrease in income from 2001 to 2002.A50%B33%C3712%DData inadequateStudy the graph and answer the following questions-

Average production of rice is what percent of the maximum recorded production of food grains over the years?A42.5%B38.4%C42.7%D40.7%
Study the graph and answer the questions.
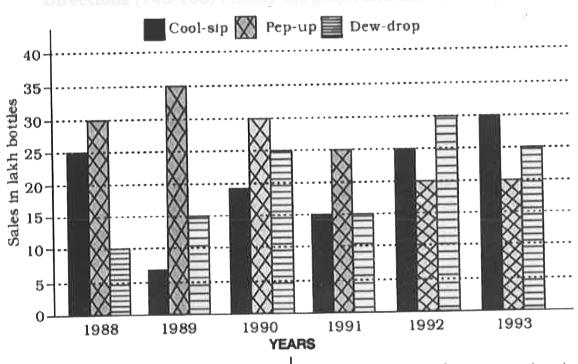
In which year sale of Dew -drop is maximum ?
View SolutionDirection : Study the following bar diagram carefully and answer the four questions.

In which year for the company A the percentage increase of production of buses with respect to the previous year is maximum?
View SolutionStudy the following bar graph and answer the question that follows.
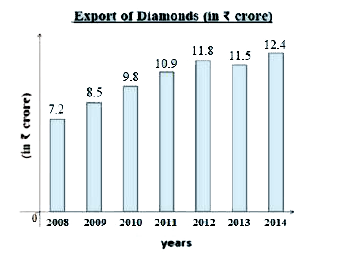
In which year was the maximum percentage increase in diamond exports compared to the previous year?
View SolutionStudy the graph and answer the questions.
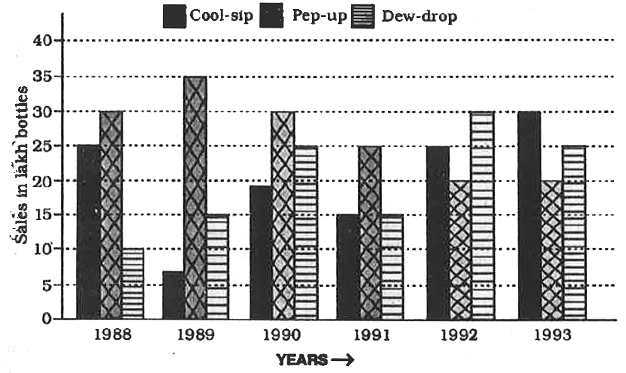
In which year sale of Drew-drop is maximum ?
View SolutionStudy the graph carefully and answer the following questions.
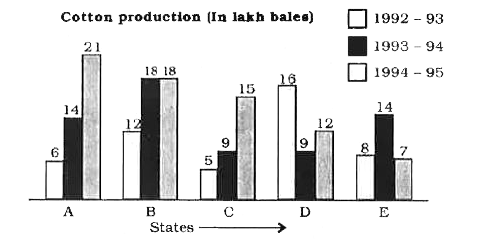
What is the average production of the four states in the year 1994-95 taken together ?
View Solution
