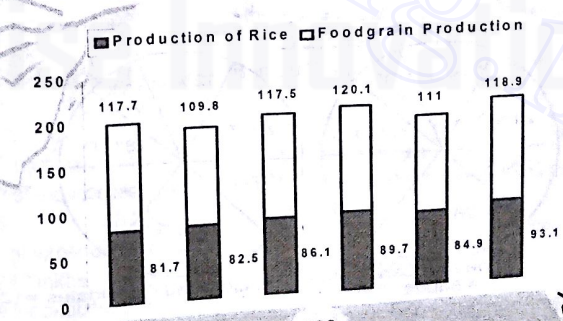
Study the graph and answer the following questions-

In which year the production of rice in total food grain production is the maximum percentage?
2007-2008
2008-2009
2009-2010
none of these
The correct Answer is:D
Topper's Solved these Questions
Similar Questions
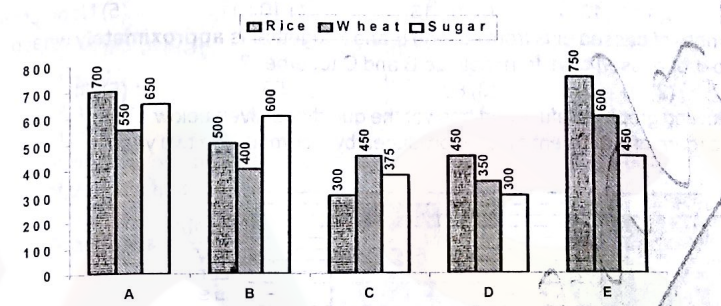
Study the following graph carefully and answer the question given below-
Amount of Rice, Wheat and Sugar Consumed by various restaurants over a years.

What is the respective ratio of the amount of Rice, Wheat and Sugar consumed by restaurant D to the same consumed by restaurant B ?
View SolutionIn one hour,a boat goes 11 km along the stream and 5 km against the stream. Then speed of the boat in still water (in km/hr) is :
View SolutionThe total of the present ages of A,B,C and D is 96 years. What is B's present age ?
(i) The average age of A, B and D is 20 years.
(ii) The average age of C and D is 25 years.
View SolutionMatch the following lists:

View SolutionHow many lines of symmetry does the above figure have ?
View SolutionWhich of the following are correct chain isomers of butane ? (i)
View SolutionDetermine the point of symmetry of a regular hexagon.
View SolutionDtermine the images of the following figure about the given line :
View SolutionMatch the following Column A to Column B

View SolutionMatch the following Column A to Column B

View SolutionMatch the following Column A to Column B

View SolutionThe inequation represented by the graph given below is :
View SolutionThe inequation that best describes the graph given below is _________
View SolutionThe inequation that best describes the following graph is _________
View SolutionWhich inequations represent the shaded region in the given figure
View SolutionWhich of the following statement is not correc for following straight line graph :-
ltimg src="https://d10lpgp6xz60nq.cloudfront.net/physics_images/ALN_PHY_R04_E01_015_Q01.png" width="80%"gt
View Solution
