Study the graph and answer the following questions-
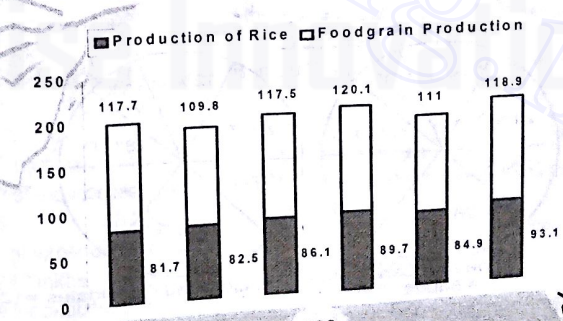
Percentage increase/decrease in production of rice in year 2009-2010 over the year 2006-2007 is about
10.4%
6%
9.8%
0.98%
The correct Answer is:C
Topper's Solved these Questions
Similar Questions
Study the following graph carefully and answer the question given below-
Amount of Rice, Wheat and Sugar Consumed by various restaurants over a years.
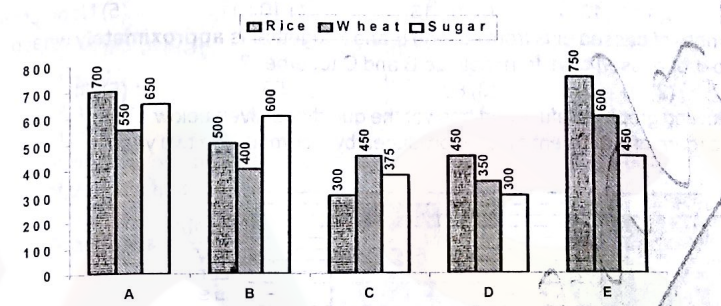
What is the respective ratio of the amount of Rice, Wheat and Sugar consumed by restaurant D to the same consumed by restaurant B ?
View SolutionIn one hour,a boat goes 11 km along the stream and 5 km against the stream. Then speed of the boat in still water (in km/hr) is :
View SolutionThe total of the present ages of A,B,C and D is 96 years. What is B's present age ?
(i) The average age of A, B and D is 20 years.
(ii) The average age of C and D is 25 years.
View SolutionCalculate the cost of living index for the year 2006 taking 1990 as the base year from the following information using weighted average method.
ltimg src="https://d10lpgp6xz60nq.cloudfront.net/physics_images/PS_MATH_IX_C18_S01_005_Q01.png" width="80%"gt
View SolutionFrom the following data, using weighted average method, calculate the cost of living index for the year 2006, taking 2002 as the base year.
ltimg src="https://d10lpgp6xz60nq.cloudfront.net/physics_images/PS_MATH_IX_C18_E03_005_Q01.png" width="80%"gt
View Solution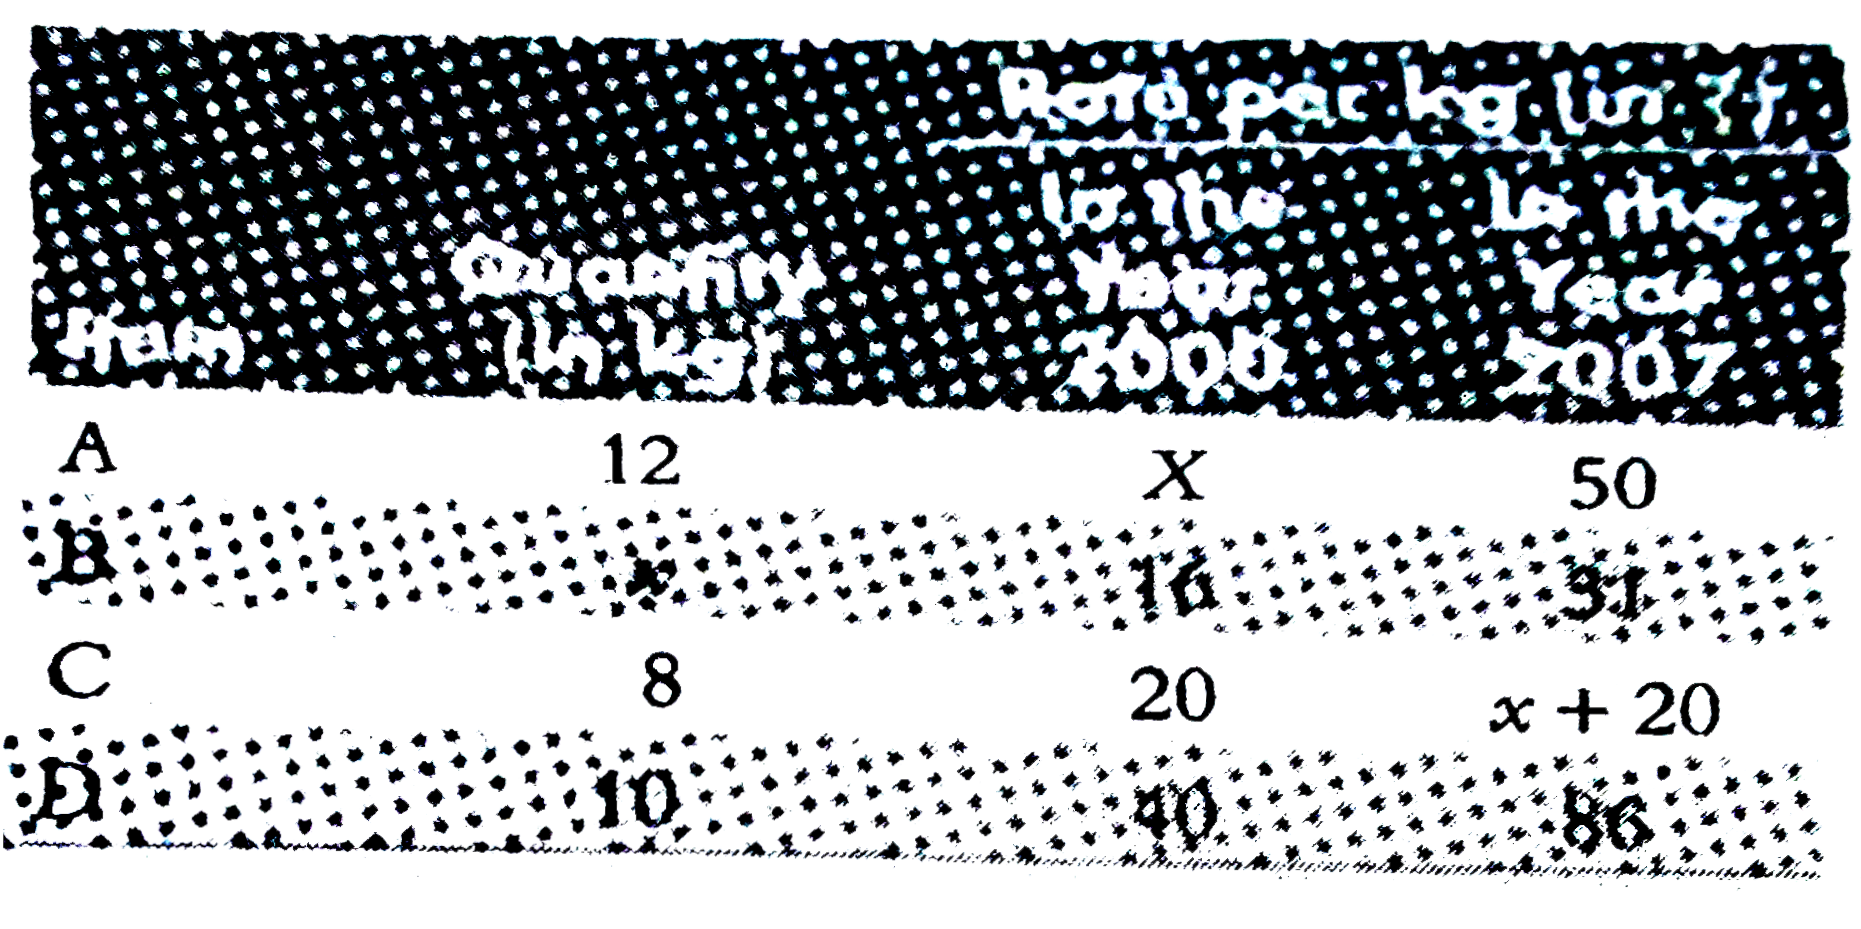
The cost of living index for the year 2007 considering the base year as 2000, is 225. Find x.
View Solution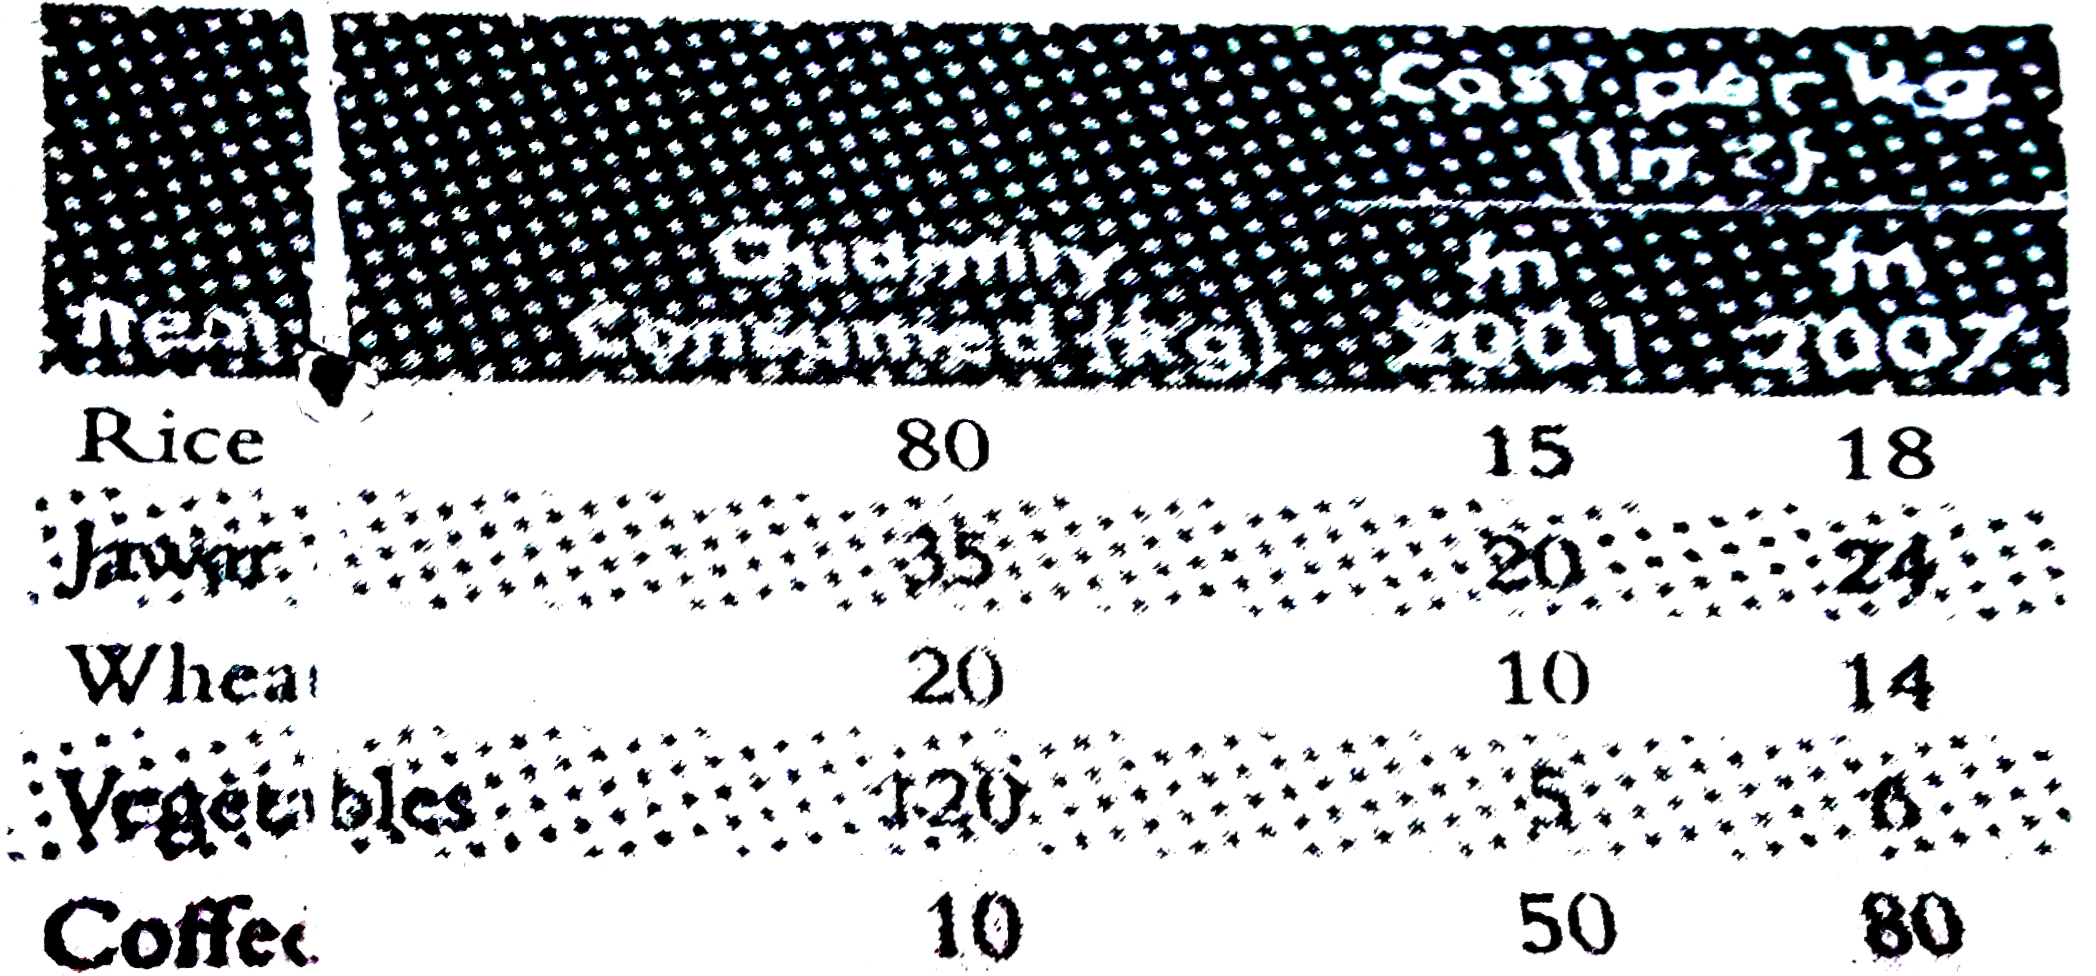
Find the cost of living index in the year 2007, taking 2001 as the base year, based on the information given above.
View Solution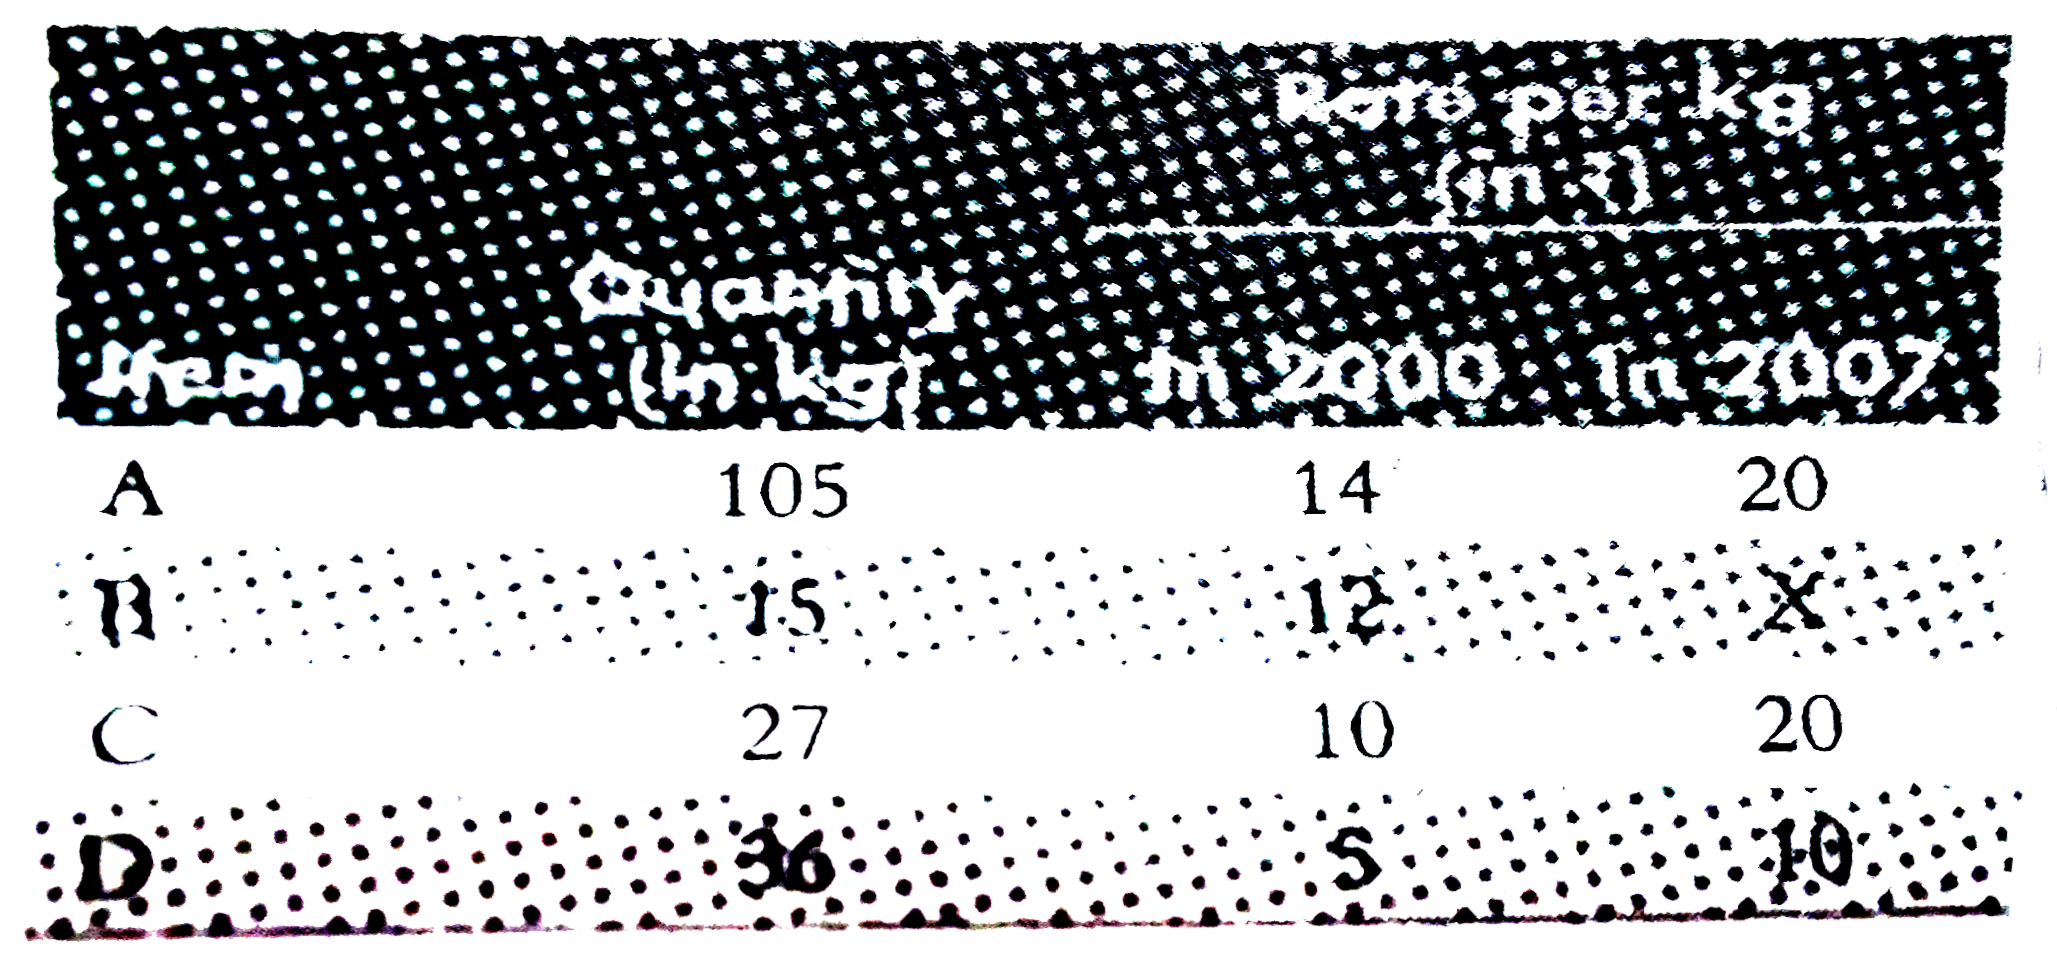
The cost of living index for the year 2007, considering the year 2000 as the base year, is 250. Find x.
View SolutionHow many lines of symmetry does the above figure have ?
View SolutionWhich of the following are correct chain isomers of butane ? (i)
View SolutionDetermine the point of symmetry of a regular hexagon.
View SolutionDtermine the images of the following figure about the given line :
View SolutionMatch the following Column A to Column B

View SolutionMatch the following Column A to Column B

View SolutionMatch the following Column A to Column B

View SolutionThe inequation represented by the graph given below is :
View Solution
