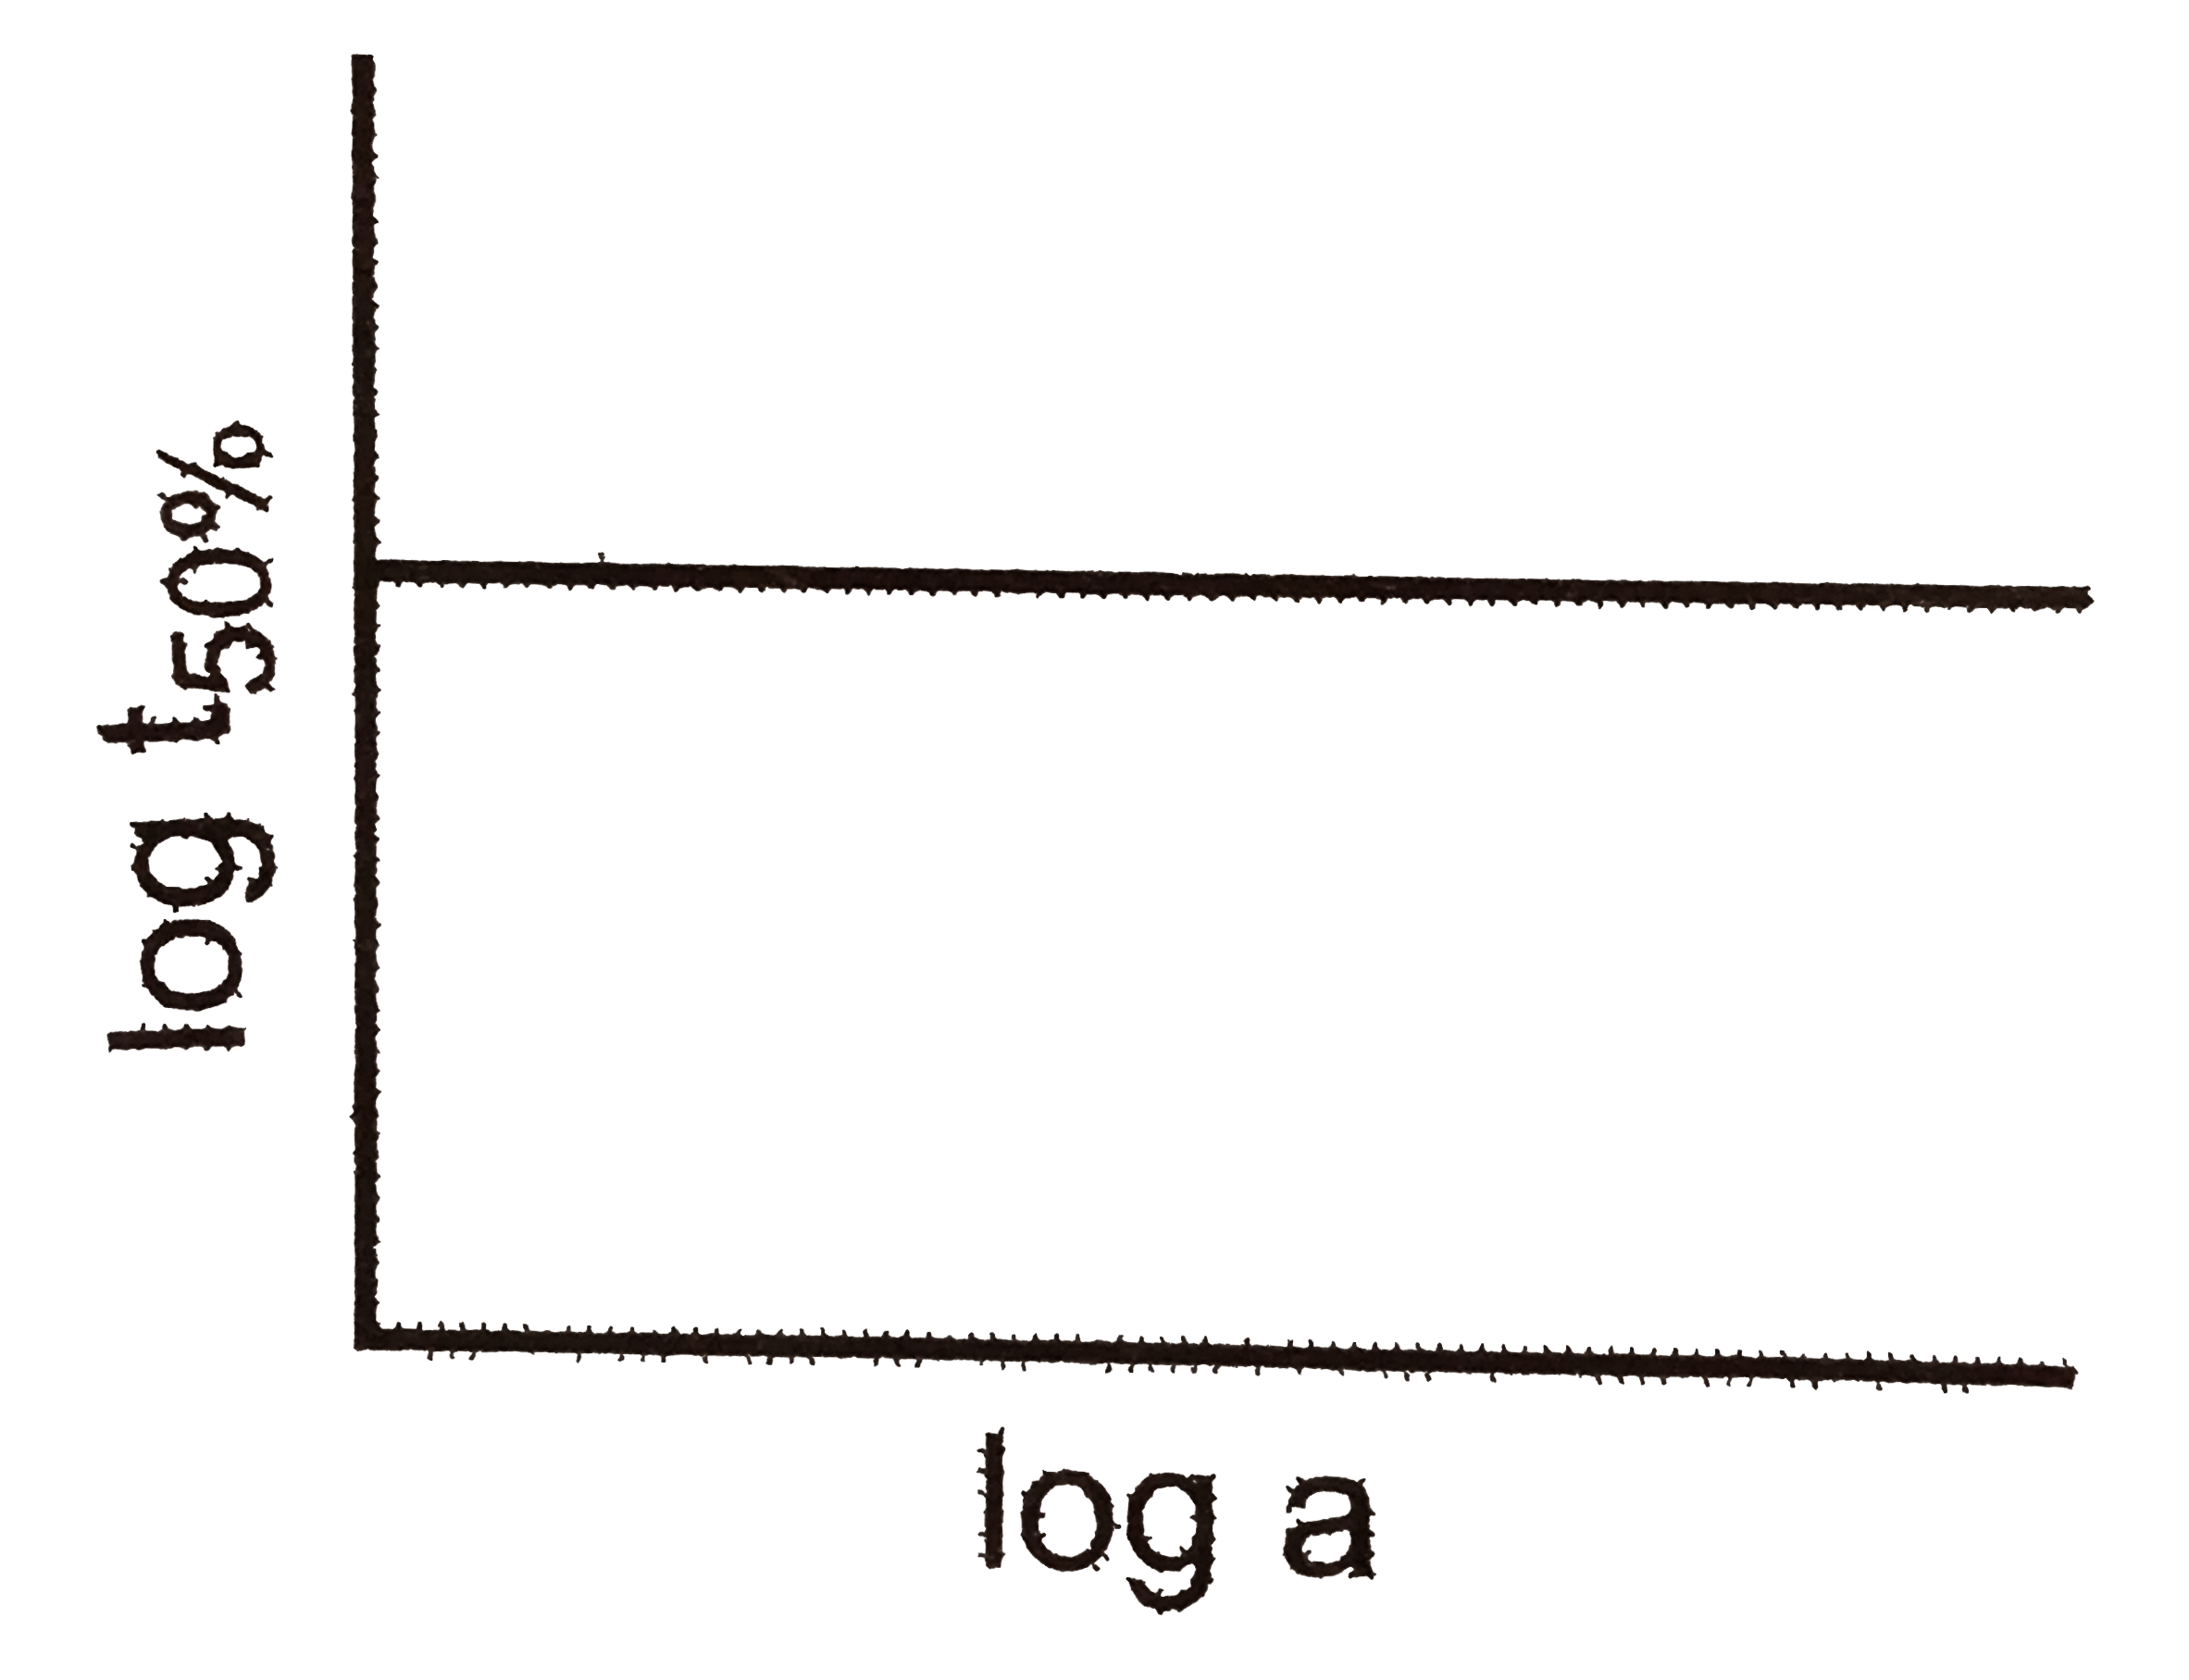
A graph plotted between log t50% vs log concentration is a straight line. What conclusion can you draw from this graph?

n=1,t1/2∝a
n=2,t1/2∝1a
n=1,t1/2=(0.693/k)
None of the above
The correct Answer is:C
Step by step video, text & image solution for A graph plotted between log t_(50%) vs log concentration is a straight line. What conclusion can you draw from this graph? by Chemistry experts to help you in doubts & scoring excellent marks in Class 12 exams.
Updated on:21/07/2023Topper's Solved these Questions
- GRAPHICAL INTERPRETATIONBOOK - GRB PUBLICATIONCHAPTER - GRAPHICAL INTERPRETATIONEXERCISE - I.Electrochemistry
1 Video
- GRAPHICAL INTERPRETATIONBOOK - GRB PUBLICATIONCHAPTER - GRAPHICAL INTERPRETATIONEXERCISE - Electrochemistry
9 Videos
- GRAPHICAL INTERPRETATIONBOOK - GRB PUBLICATIONCHAPTER - GRAPHICAL INTERPRETATIONEXERCISE - H. Chemical Kinetics
1 Video
- F-BLOCK ELEMENTSBOOK - GRB PUBLICATIONCHAPTER - F-BLOCK ELEMENTSEXERCISE - Subjective type
7 Videos
- HYDROCARBON (ALIPHATIC)BOOK - GRB PUBLICATIONCHAPTER - HYDROCARBON (ALIPHATIC)EXERCISE - Previous years jee questions
28 Videos
Similar Questions
You are given the following cell at 298 K with E∘cell=1.10V
Zn(s)∣∣Zn2+(C1)∣∣∣∣Cu++(C2)∣∣Cu(s)
where C1 and C2 are the concentration in mol/lit then which of the following figures correctly correlates Ecell as a function of concentrations x-axis log(C1C2) and y-axis Ecell
View SolutionWhich of the following curve represents the variation of λm with √C for AgNO3?
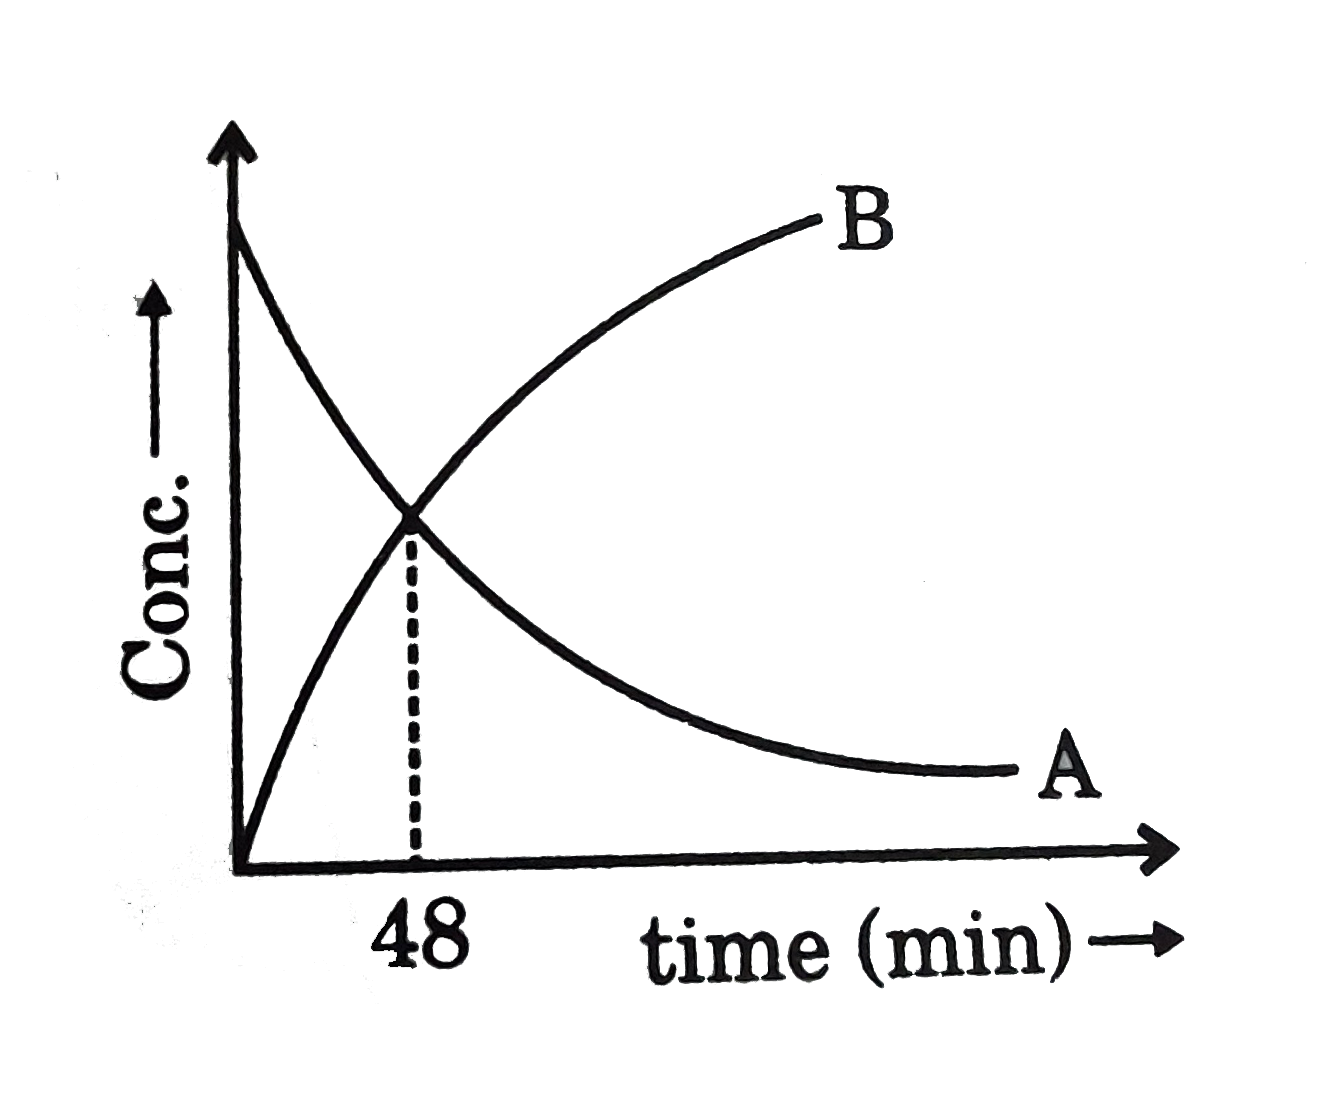
View SolutionFor a 1st order reaction, nA→B whose concentration vs time curve is shown ahead. If half life for the reaction is 24 minutes, the value of n is:

View SolutionThe first f-block organometallic compound [ThH(OR)(C5Me5)2] was prepared in late 1970s. Find the oxidation state of central metal atom/cation.
View SolutionWhich of the following will decolourise alkaline KMnO4?
View SolutionDraw the plot log V vs log T.
View SolutionA graph plotted between log t50% vs log concentration is a straight line. What conclusion can you draw from this graph?

View SolutionWhich conclusion can be drawn if a graph is plotted between log t50% vs. log [reactant] if it show an intercept 'A' and tanθ=0?
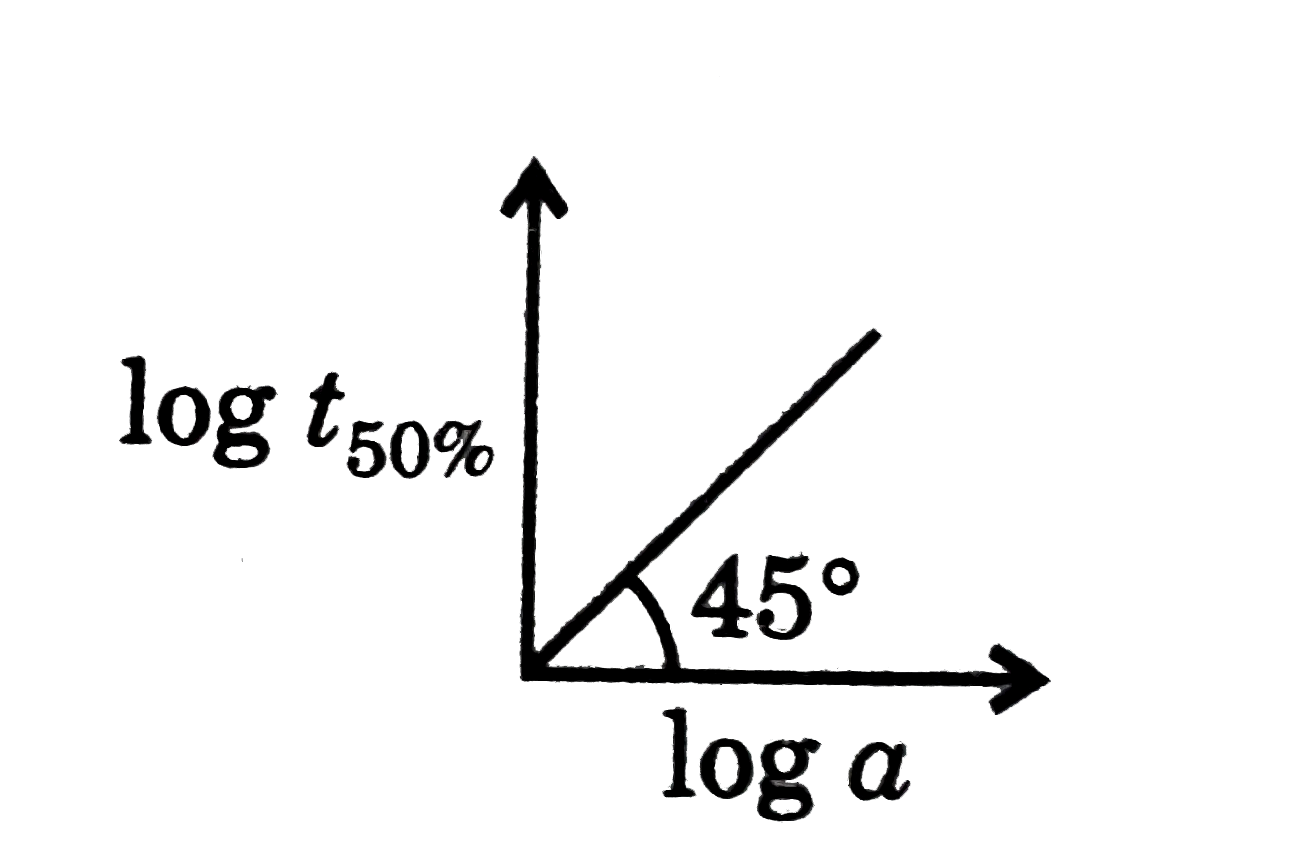
View SolutionWhat will be the order of reaction and rate constant for a chemical change having log t_(50%) vs log concentration of (a) curves as:
View SolutionA graph plotted between log k vs (1)/(T) is represented by
View SolutionA graph plotted between log t50% vs log concentration is a straight line. What conclusion can you draw from this graph?

View SolutionA graph plotted between log t_(50%) vs log concentration in a straight line. What conclusion can you draw from this graph?
View SolutionWhat will be the order of reaction and rate constant for a chemical change having log t50% vs log concentration of (a) curves as:

View SolutionA graph plotted between logt50 vs log concentration is a straight line. What conclusion can you draw the given graph?

[Given : n = order of reaction]
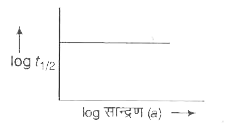
View Solutionlogt1/2 तथा log सान्द्रण (a) के बीच एक ग्राफ खींचने पर एक सरल रेखा प्राप्त हुई। इस ग्राफ से आप क्या निष्कर्ष निकाल सकते हैं?

n = अभिक्रिया कोटि
View Solutionlogxn तथा log p के मध्य ग्राफ खींचने पर सीधी रेखा पाप्त होती है जिसका ढाल किसके तुल्य होगा-
View Solution

